New All-Time Highs for Small Caps
Market Outlook
The S&P 500 fell 3.1% in the month of January, but then in the first week of February posted its largest weekly gain in more than two years. There has been tremendous market volatility resulting in little directional movement. The market had gone nowhere since November, but the trading range finally broke out to the upside on Friday February 13th with the S&P 500 and Russell 2000 hitting all-time highs and the Nasdaq hitting a 15-year high. The Dow Jones Industrial Average is within 85 points of an all-time high and should break out soon. According to technician Urban Carmel, a breakout to the upside was more likely because:
SPY has now reversed off the same support level five times in a month. Rejection of the downside is normally bullish.
Market strategist Tom Lee recently explained why the tug-of-war between bears and bulls appears to have been won by the bulls:
The ‘half-empty’ viewed markets as vulnerable to a ‘tail event’ from Europe (Greece exit from Euro, deflation), Japan (deflation) or China (economic deceleration), despite good US fundamental and the ‘half-full’ who saw primacy in strong US fundamentals. In the past few weeks, the ‘scary things’ such as sliding oil, surging dollar, plunging interest rates have all stabilized and have provided enough incremental visibility for the markets to find its footing.
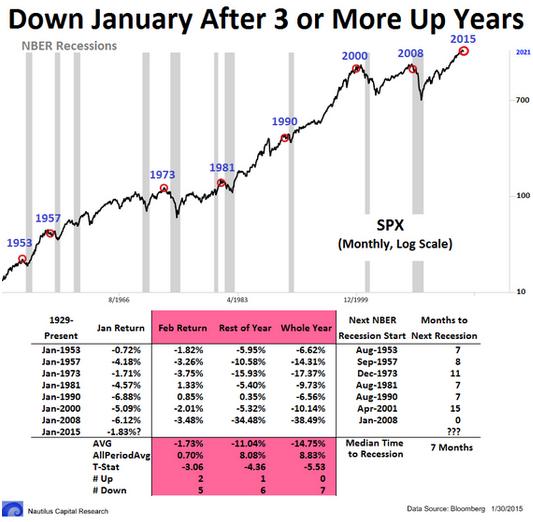
According to the January indicator, a down January increases the risk of further stock declines for the remainder of the year. Whereas the stock market has risen 90% of the time for the entire year with an average gain of 16.9% when January is an up month, the market has risen only 44% of the time for the entire year with an average loss of -3.4% when January is a down month. The odds are even worse when a down January occurs after three straight up years; in the past seven instances, the average price change for the full year is negative 11%. Stocks only rose one time and even then the gain was less than 1%. On the other hand, stocks rose during the first five days of January 2015. Whenever the first five days of January are up, the market has risen for the full year 85.4% of the time, but when you limit the analysis to times when the first five days of January are up and the period between November 19th and January 19th is down, stocks have subsequently fallen significantly in two of the three instances since 1950.
Based on history, another year of stock gains is unlikely — the stock market has never risen in seven consecutive calendar years. All of the above historical data could just be a coincidence, of course. Economic fundamentals should always trump trivia. Other signs of trouble:
- The year 2014 marked the second-highest Investor Intelligence bullish sentiment in history (defined as bullish newsletter advisers as a percentage of bulls plus bears). The average stock-market return in the year following such a high sentiment reading is only 0.1% (compared to 17.4% in years following low sentiment readings).
- Yale economics professor and Nobel Laureate Robert Shiller says that stock valuations are extremely expensive and currently “higher than ever before except for the times around 1929, 2000, and 2008, all major market peaks.”
- Chinese inflation in January hit a five-year low.
- The Eurozone is experiencing its steepest deflation ever, with January deflation of -0.6% year-over-year.
- The Greece election win of the “radical leftist” and anti-austerity Syriza Party promises conflict with Germany and the European Union that may result in Greece’s exit from the Euro and a huge credit default that would seriously roil European financial markets.
A growing U.S. economy means growing corporate profits, which helps support higher stock prices. Evidence of a strong U.S. economy includes:
- U.S. GDP growth rose 2.6% in the fourth quarter, which was less than the sizzling 5.0% growth rate in the third quarter (11-year high), but full-year 2014 still ended up 2.4% — the fastest annual rate of growth since 2010.
- Consumer spending grew 4.3% in the fourth quarter – the fastest since the first quarter of 2006 and an acceleration from the third quarter’s 3.2%.
- Single family housing starts in December were the highest since the 2008-09 recession. Home sales were also the highest in 7 years.
- Including the January 2015 employment report, the past three months of job gains (Nov. through Jan.) capped the biggest three- month advance in 17 years. In addition, January wages increased by the largest amount since 2008. Wage growth had been the one “critical missing piece” in the economic recovery, so its emergence is very welcome but also makes it more likely that the Fed will start raising rates.
Even though the Fed’s quantitative easing (QE) program stopped new bond purchases in October, the cumulative QE stimulus remains in full force and effect since the Fed has not started shrinking its balance sheet — all maturing bonds are being reinvested. 2015 should be a good year for the U.S. economy, but those industries hurt by low oil prices are not likely to recover soon since the recent oil rally (Jan. 30th through Feb. 3rd was the best three-day rally in six years) is likely a dead-cat bounce as inventories continue to rise. The number oil rigs in operation continues to decline. The current drop serves as about a 35% drop from the most recent peak, and on its most recent earnings conference call Baker Hughes said that in past downturns, the number of rigs in use has declined by 40%-60%.
This oil-price decline is supply related rather than demand related. It’s easier to cut supply than stimulate demand, so depressed prices could be short-lived. The International Energy Agency expects prices to remain depressed in the $40-$50 per barrel zone for the next six months as marginal suppliers try to stay afloat by dumping their remaining inventory on the market, but after they go bankrupt, supply cuts could start taking effect and prices could slowly rise into the $65-$75 per barrel zone by the end of 2015 and into early 2016.
Bond king Jeffrey Gundlach predicts U.S. interest rates will stay low because the rest of the world is cutting rates and oil prices will stay low. Some pockets of U.S. economic weakness do exist, including a 3.4% decline in January durable goods orders and Caterpillar’s poor business outlook for 2015. Indeed, U.S. inflation is decelerating and the December consumer price index (CPI) rose by only 0.8% year-over-year, the smallest increase since October 2009, and dropped sequentially month-to-month by -0.4%, the largest monthly decline in six years (December 2008).
The iShares 20+ year Treasury Bond ETF (TLT) hit an all-time price high on the last trading day of January, but has fallen 7.4% in February. Anyone who bought TLT on January 30th has already lost three years of interest payments in 10 trading days! The day of reckoning for bonds is coming and TLT will go down severely at some point in 2015. Bonds had previously rallied the most to start a calendar year since 1988, which is a once-in-a-quarter-century phenomenon and could have signaled a blow-off top. Bond prices and oil prices are inversely correlated, however, so if oil prices fall back down to test support, bond prices may rise back up to test resistance.
The Fed’s January 28th policy statement appeared slightly dovish. Bond king Bill Gross and Richmond Fed bank president Jeffrey Lacker are both predicting a June rate hike, whereas futures traders are betting that a rate hike won’t occur until September.
Bottom line: For now, I would stay invested because the Ivy Portfolio market-timing system based on the 10-month moving average remains on a “buy” signal for U.S. stocks, bonds, and real estate (sells are foreign stocks and commodities). At the end of January, the S&P 500 barely remained above the moving average by only 13 points, but has bounced nicely above it since. As of February 13th, the S&P 500 is 94 points above its 10-month moving average (2097 vs. 2003).
Over the past 25 years, stocks have peaked on the 9th trading day of February (this year that means Thursday Feb. 12th) and fallen for the rest of the month, so we may be near a short-term stock-market top as both oil prices and bond yields retrace their recent bounces. But a resumption of the six-year market rally in March is likely as Urban Carmel states:
The S&P 500 is now trading above its key moving averages and making higher highs. This is the definition of an uptrend. At new highs, there are no unprofitable shareholders and thus no forced sellers. And, to be clear, there’s no doubt that new highs now are a positive. The positive this time is that the indices (except DJIA) are coordinated, with all breaking higher in unison. The other likely positive this time is the long base formed over the prior months; in the case of Russell 2000, the base extends back a year. Break outs from a long base are usually more likely to be durable.
In other words, the upside breakout in small caps (i.e., Russell 2000) is the most impressive and likely to be the most long-lasting of all the rallies in the stock indices.
Roadrunner Stocks Relative Performance
Small-cap stocks have outperformed the large-cap S&P 500 in only four of the 24 Roadrunner time periods, but here’s the good news: all four instances of small-cap outperformance (three momentum and one value) have just occurred in the last four consecutive time periods! This recency of small-cap outperformance is significant because it suggests that we are in the beginning stages of a small-cap comeback that is gaining steam and persistence.
Comparative Index Total Return Thru February 12th
Roadrunner Issue Start Date | S&P 500 ETF (SPY) | Vanguard Small-Cap Value (VBR) | PowerShares DWA SmallCap Momentum (DWAS) | Advantage |
January 24th, 2013 | 45.44% | 44.10% | 38.65% | Large cap |
February 27th, 2013 | 43.04% | 40.97% | 35.16% | Large cap |
March 28th, 2013 | 38.08% | 34.86% | 26.57% | Large cap |
April 26th, 2013 | 36.71% | 36.54% | 27.80% | Large cap |
May 24th, 2013 | 30.87% | 30.55% | 21.87% | Large cap |
June 28th, 2013 | 34.15% | 32.36% | 21.58% | Large cap |
July 29th, 2013 | 27.65% | 24.66% | 13.08% | Large cap |
September 3rd, 2013 | 30.91% | 29.15% | 13.14% | Large cap |
October 1st, 2013 | 26.46% | 21.30% | 5.49% | Large cap |
November 4th, 2013 | 21.10% | 17.05% | 5.80% | Large cap |
December 2nd, 2013 | 18.62% | 15.32% | 2.04% | Large cap |
January 6th, 2014 | 16.80% | 13.27% | 1.77% | Large cap |
January 30th, 2014 | 18.84% | 14.41% | 2.40% | Large cap |
March 4th, 2014 | 13.55% | 8.12% | -4.47% | Large cap |
April 3rd, 2014 | 12.42% | 6.93% | 1.12% | Large cap |
May 6th, 2014 | 13.53% | 10.21% | 11.20% | Large cap |
June 5th, 2014 | 9.06% | 5.48% | 5.90% | Large cap |
July 7th, 2014 | 6.86% | 3.18% | 1.79% | Large cap |
August 7th, 2014 | 10.48% | 8.44% | 9.87% | Large cap |
September 10th, 2014 | 5.49% | 3.61% | 4.12% | Large cap |
October 10th, 2014 | 10.25% | 13.75% | 17.18% | Small-cap Momentum |
November 11th, 2014 | 2.89% | 3.07% | 4.09% | Small-cap Momentum |
December 15th, 2014 | 5.29% | 6.45% | 7.31% | Small-cap Momentum |
January 13th, 2015 | 3.38% | 3.72% | 3.15% | Small-cap Value |
Source: Bloomberg
Half (20 out of 40) of Roadrunner recommendations have outperformed their respective small-cap benchmarks and both the Value and Momentum portfolios have each generated positive double-digit average returns that have outperformed their respective benchmarks. The Value Portfolio shows 9 out of 20 holdings (45%) outperforming VBR and sports an average return since inception of 20.04%, 2.48 percentage points better than VBR. In contrast, the Momentum Portfolio has 11 of its 20 holdings (55%) outperforming DWAS and sports an average return since inception of 23.34%, 15.27 percentage points better than DWAS.
One of the disadvantages of selling a portfolio’s biggest winner is that it causes the return of the current portfolio to look less good, which is what happened after I recommended selling United Therapeutics (UTHR). By selling UTHR, its huge 153.36% return was no longer part of the current’ Value portfolio’s performance measurement. My job, however, is to maximize the investment return of Roadrunner members and not worry about cosmetics like current vs. closed portfolio return numbers!
Performance Scorecard
Overall, 26 of 40 Roadrunner holdings (65%) have generated positive absolute returns. Below, each Roadrunner portfolio lists the best relative performers in descending order:
Value Portfolio
(thru February 12th)
Roadrunner Stock | Start Date | Roadrunner Performance | Vanguard Small-Cap Value (VBR) | Roadrunner Outperformance? |
Brocade Communications (BRCD) | 2-27-13 | 116.81% | 40.97% | +75.84% |
Diamond Hill Investment Group (DHIL) | 1-24-13 | 111.58% | 44.10% | +67.48% |
Gentex (GNTX) | 1-24-13 | 91.65% | 44.10% | +47.55% |
Silicon Image (SIMG) | 8-7-14 | 49.18% | 8.44% | +40.74% |
U.S. Ecology (ECOL) | 9-3-13 | 60.95% | 29.15% | +31.80% |
Alliance Fiber Optic Products (AFOP) | 11-11-14 | 22.41% | 3.07% | +19.34% |
W.R. Berkley (WRB) | 3-04-14 | 25.86% | 8.12% | +17.74% |
Werner Enterprises (WERN) | 4-03-14 | 19.07% | 6.93% | +12.14% |
Harte-Hanks (HHS) | 12-15-14 | 14.63% | 6.45% | +8.18% |
Stewart Information Services (STC) | 10-1-13 | 17.54% | 21.30% | -3.76% |
Vishay Precision Group (VPG) | 10-10-14 | 2.45% | 13.75% | -11.30% |
Weyco Group (WEYS) | 1-30-14 | 2.99% | 14.41% | -11.42% |
Exactech (EXAC) | 11-4-13 | -2.63% | 17.05% | -19.68% |
AGCO Corp. (AGCO) | 5-6-14 | -9.88% | 10.21% | -20.09% |
Sanderson Farms (SAFM) | 7-7-14 | -20.07% | 3.18% | -23.25% |
Gulf Island Fabrication (GIFI) | 6-05-14 | -18.40% | 5.48% | -23.88% |
Rayonier Advanced Materials (RYAM) | 1-13-15 | -20.75% | 3.72% | -24.47% |
FutureFuel (FF) | 3-28-13 | 3.03% | 34.86% | -31.83% |
RPC Inc. (RES) | 9-10-14 | -40.50% | 3.61% | -44.11% |
Stepan Co. (SCL) | 6-28-13 | -25.04% | 32.36% | -57.40% |
20-Stock Averages |
| 20.04% | 17.56% | 2.48% |
Source: Bloomberg
Momentum Portfolio
(thru February 12th)
Roadrunner Stock | Start Date | Roadrunner Performance | PowerShares DWA SmallCap Momentum (DWAS) | Roadrunner Outperformance? |
G-III Apparel (GIII) | 5-24-13 | 147.38% | 21.87% | +125.51% |
VCA Inc. (WOOF) | 4-03-14 | 56.97% | 1.12% | +55.85% |
Marcus & Millichap (MMI) | 8-7-14 | 60.74% | 9.87% | +50.87% |
U.S. Physical Therapy (USPH) | 4-26-13 | 75.83% | 27.80% | +48.03% |
Apogee Enterprises (APOG) | 11-4-13 | 43.78% | 5.80% | +37.98% |
Vipshop Holdings (VIPS) | 5-6-14 | 45.34% | 11.20% | +34.14% |
Hill-Rom Holdings (HRC) | 9-3-13 | 40.25% | 13.14% | +27.11% |
Chase Corp. (CCF) | 1-30-14 | 24.92% | 2.40% | +22.52% |
CBOE Holdings (CBOE) | 1-6-14 | 23.84% | 1.77% | +22.07% |
Taro Pharmaceutical (TARO) | 12-15-14 | 19.23% | 7.31% | +11.92% |
China Biologic Products (CBPO) | 1-13-15 | 3.76% | 3.15% | +0.61% |
OmniVision Technologies (OVTI) | 11-11-14 | 1.75% | 4.09% | -2.34% |
EQT Midstream Partners L.P. (EQM) | 8-7-14 | 5.50% | 9.87% | -4.37% |
BitAuto Holdings (BITA) | 8-7-14 | -3.21% | 9.87% | -13.08% |
NuStar GP Holdings (NSH) | 8-7-14 | -3.91% | 9.87% | -13.78% |
Platform Specialty Products (PAH) | 11-11-14 | -9.88% | 4.09% | -13.97% |
Autohome (ATHM) | 11-11-14 | -15.27% | 4.09% | -19.36% |
Anika Therapeutics (ANIK) | 6-5-14 | -13.69% | 5.90% | -19.59% |
The Greenbrier Companies (GBX) | 9-10-14 | -16.93% | 4.12% | -21.05% |
Gentherm (THRM) | 9-10-14 | -19.48% | 4.12% | -23.60% |
20-Stock Averages |
| 23.34% | 8.07% | 15.27% |
Source: Bloomberg
Correlation Analysis
Please note: The goal of the Momentum Portfolio will be that all short-term stock holdings move in the same positive direction at the same time. Consequently, I only provide correlation data for the Value Portfolio (long-term focus).
The Value Portfolio Front Runner this month – Lattice Semiconductor (LSCC) — provides low correlation with the other existing holdings. Using a stock correlation calculator, I created a correlation matrix for the Roadrunner Value Portfolio, including this month’s recommendation of Lattice Semiconductor (LSCC). The time frame for the correlations was daily measuring periods over three years:
Value Portfolio 3-Year Correlations
LSCC | |
AFOP | 0.104 |
AGCO | 0.118 |
BRCD | 0.044 |
DHIL | 0.024 |
ECOL | 0.046 |
EXAC | 0.151 |
FF | 0.234 |
GIFI | 0.231 |
GNTX | 0.223 |
HHS | 0.045 |
RES | 0.248 |
RYAM | -0.135 |
SAFM | -0.096 |
SCL | 0.221 |
STC | 0.130 |
VPG | 0.116 |
WERN | 0.188 |
WEYS | 0.139 |
WRB | 0.337 |
As you can see above, Lattice Semiconductor provides modest benefits to the Value Portfolio. Based on my portfolio analysis software, after deleting data-transfer firm Silicon Image, the Value Portfolio was slightly underweight the “technology” sector and slightly overweight the “cyclical” stock type, so adding another cyclical technology company is diversification-neutral for the portfolio.
Next month I’ll look to add a healthcare stock because healthcare is the industry sector that has been under-represented in the Value Portfolio ever since I sold United Therapeutics last month.
Value Portfolio Composition After Silicon Image is Sold
But Before Lattice Semiconductor is Added
Industry Sector | Roadrunner Value Portfolio | Mid/Small Cap Benchmark | |
Cyclical | 47.40 | 40.89 | |
Basic Materials | 15.78 | 5.19 | |
Consumer Cyclical | 15.79 | 15.65 | |
Financial Services | 15.83 | 15.07 | |
Real Estate | 0 | 4.98 | |
Sensitive | 42.08 | 40.31 | |
Communication Services | 0 | 1.30 | |
Energy | 10.52 | 5.40 | |
Industrials | 15.78 | 17.29 | |
Technology | 15.78 | 16.33 | |
Defensive | 10.52 | 18.77 | |
Consumer Defensive | 5.27 | 4.63 | |
Healthcare | 5.25 | 11.43 | |
Utilities | 0 | 2.71 |
Stock Type | Roadrunner Value Portfolio | Mid/Small Cap Benchmark | |
High Yield | 5.26 | 0.98 | |
Distressed | 0 | 2.57 | |
Hard Asset | 10.52 | 9.04 | |
Cyclical | 52.66 | 51.73 | |
Slow Growth | 5.25 | 10.22 | |
Classic Growth | 10.51 | 5.57 | |
Aggressive Growth | 15.79 | 9.43 | |
Speculative Growth | 0 | 5.87 | |
Not Classified | 0 | 4.60 |
Source: Morningstar
Lattice Semiconductor has a very low correlation with Rayonier Advanced Materials (RYAM) and Sanderson Farms (SAFM) because semiconductors used in smartphones and Internet networks are in a cyclical, consumer discretionary industry that performs best when the economy is strong, whereas materials used in consumer defensive products (e.g., cigarette filters, drugs) and poultry outperform during modest economic growth.
Looking at the correlation matrix below, the best diversifiers are those with a lot of red shadings. If you don’t already own cigarette-filter company Rayonier Advanced Materials (RYAM) or poultry-processor Sanderson Farms (SAFM) in the Value Portfolio, now would be a good time to pick up some shares as both are currently trading at a buyable price level.
A total correlation matrix is shown below:
Value Portfolio

Stock Talk
Add New Comments
You must be logged in to post to Stock Talk OR create an account