Small Caps Are Outperforming Large Caps
Market Outlook
On March 9th, the S&P 500 celebrated the sixth birthday of its amazing bull market, and has now rallied more than 200% since 2009. A bull market is defined as a period where the S&P 500 gains 20% or more without a decline of 20% in between. Of the three other bull markets since World War II that have lasted at least six years, two continued to rally without a 20% dip for at least another year — 13.5 months (June 1949- Aug. 1956) and 3.5 years (Oct. 1990- Mar. 2000), respectively. The last all-time high occurred on February 25th (intraday) and March 2nd (closing), respectively. Trading-range price fluctuations aside, the market has made no material upside progress since November (four months of back and forth). Three consecutive weeks of advances starting in early February were immediately followed by three consecutive weeks of declines starting in late February. The worst one-day decline in two months on March 10th was followed by the best one-day gain in five weeks on March 12th. According to market technician Urban Carmel, stock-price movement has become “extremely binary” which is unusual and historically (2004, 2005 and 2011) has presaged continued sideways action for eight months or longer:
2015 will not be like 2013 or 2014. This is a year where fundamentals improve while equity prices mark time, allowing sentiment and valuation to fall back inline.
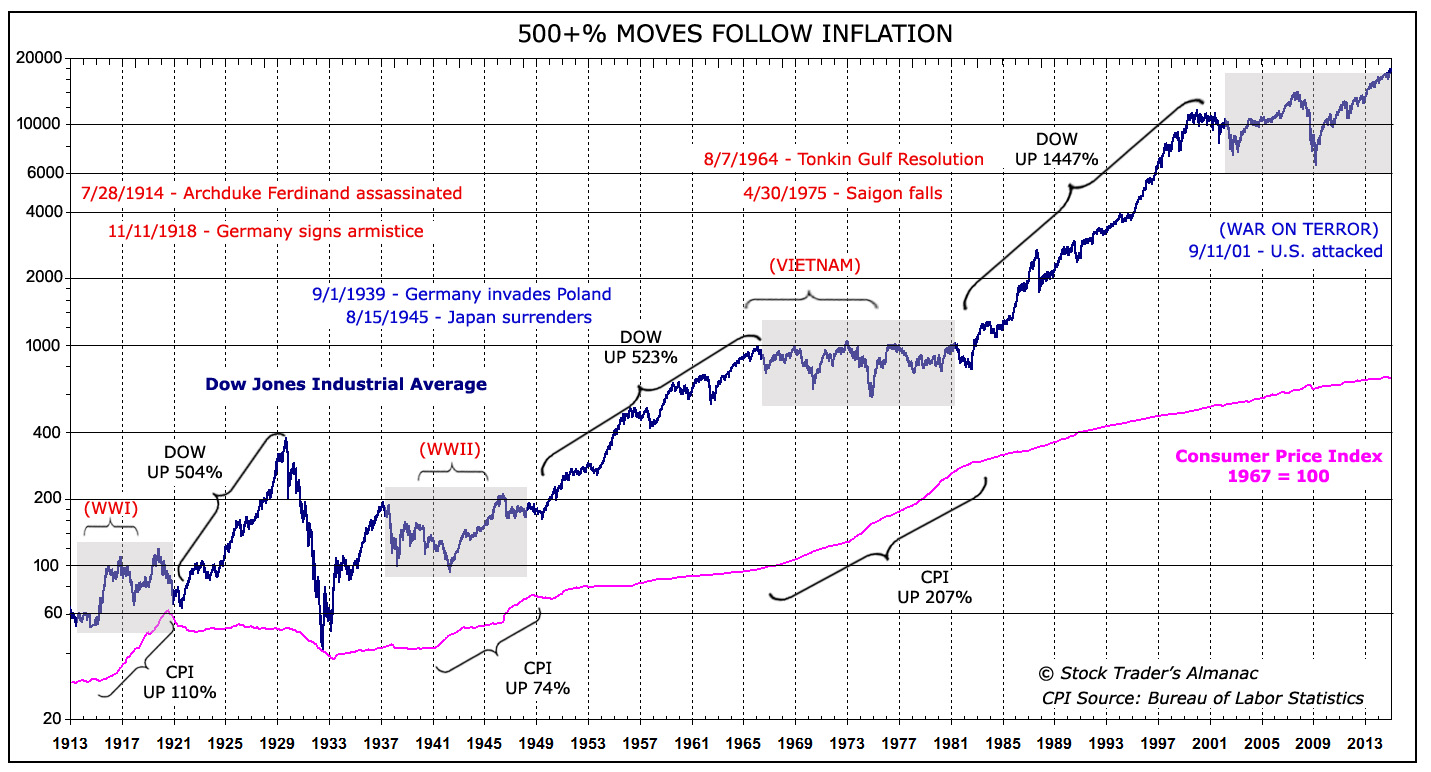
A flat market is consistent with a bull-market continuation, since a bull market doesn’t require additional gains but simply requires that a 20% correction not occur. Jeff Hirsch of the Stock Trader’s Almanac is slightly more optimistic about continued upward movement in 2015, but then expects a bear market to take place between 2016 and 2018 before inflation causes a “super boom” that takes the stock market up 500% between 2018 and 2025:
We still expect the market to leak higher through the spring of 2015 toward our forecasted first half high of about DJIA 19000. Then after some choppy sideways summer trading, the market should rally into year-end perhaps making a slightly higher high. While I firmly believe there is still upside left in the stock market, we do appear to be beginning a topping process that make take many moons, yet may occur later this year or early next year. Whenever the top comes, we expect the bulk of the downside to transpire 2016-18 when the next secular bull is likely to begin.
One obvious catalyst for a stock-market correction is valuation. According to both Meb Faber and Doug Short, the stock market is the most expensive in U.S. history based on a several different metrics (e.g., price-to-sales, 10-year P/E, Q ratio). On the other hand, Barry Ritholtz points out that the stock market remains reasonably valued based on the important metric of enterprise value-to-EBITDA, so a market correction may have to wait for this last valuation metric to become extended.
The immediate cause of the recent back-and-forth market action is investor indecision concerning U.S. corporate profits and the timing of the Federal Reserve’s first interest-rate hike since 2006. A surging U.S. dollar climbing to a 12-year high against the Euro will hurt earnings of U.S. multinationals that generate substantial revenue overseas. On the other hand, a weak Euro will boost profits of European multinationals and, along with the commencement of quantitative monetary easing, are the main reasons European Central Bank president Mario Draghi stated on March 16th that the Euro-zone economies were “steadily recovering.” The German stock market responded by hitting an all-time high. Historical precedent is mixed concerning the effect of an appreciating U.S. dollar on the U.S. stock market. Some argue that it is more important to global economic health for European profits and economic activity to improve than it is for U.S. profits to rise even further than they have. If European economic health is the critical issue right now, then U.S. stocks should continue to rise despite the higher U.S. dollar.
The other issue is interest rates and U.S. economic data is generally positive. As Urban Carmel describes it:
We are now starting to see consistently better growth. Highlights:
In the past 12 months, the average monthly gain in employment has been 275,000, the highest since 1994
Despite improving employment, there hasn’t been any notable sustained acceleration in wages
Real personal consumption (70% of GDP) grew 3.4% in January, the highest rate of growth in 8 years.
The manufacturing component of industrial production grew 6.0% in January, the highest rate in 4 years
New home sales were the highest in 7 years for the second month in a row
However, the inflation rate continues to decelerate. It has fallen to its lowest level since 2009
Recent economic news has been mixed, with February jobs growth very strong compared to February retail sales and manufacturing, which were both very weak. Both of these economic indicators are considered “coincident,” so they are predictive of the economy’s future trend only in so far as the future tends to mirror the present. The tie-breaker may be the historical tendency of macroeconomic data to underperform expectations in the first half of calendar years. According to the Citigroup Economic Surprise Index (CESI), the degree by which actual economic data is missing estimates is near a historical low (page 4) and should start to improve soon. Advantage: stronger economic data.
Pursuant to the Federal Reserve’s March 18th meeting, the Fed eliminated the “patient” language from the policy statement, but also said that a rate hike at the Fed’s April 29th meeting was “unlikely.” Although a June 17th interest-rate hike is possible, language in the policy statement was more dovish than expected, leading some to conclude that a rate hike won’t occur until September, which predictably caused the stock market to jump 1.25% higher in a single day. For example, the statement noted that “inflation has declined further below the Committee’s longer-run objective” and the Fed dramatically lowered its projected interest rate path, known as the Fed’s “dot plots,” to a year-end Fed Funds rate forecast of only 0.625% from the previously-anticipated 1.125%. Fed fund futures are predicting a 0.25% interest-rate hike at the September 17th Fed meeting.
Rising interest rates are not a problem for small caps. As I wrote in Small-Cap Stocks: The Time to Invest is Now, small-cap stocks actually outperform large-cap stocks in a rising-rate environment because small caps don’t have much debt and are very sensitive to stronger economic growth (which is correlated with rising interest rates). For this and other reasons, it is a good time to “go small.” Wells Capital’s Jim Paulsen thinks its time to buy small caps:
2015 may prove to be a good year for small-cap stocks. First, in 2014, net flows into small-cap EFT funds trailed large-cap flows by the largest margin of any year since at least 2000! Indeed, small-cap fund flows have been paltry in the last few years leaving many investors significantly underexposed to small-cap stocks. Second, the relative price/earnings (P/E) multiple (based on future one-year mean earnings estimates) for small-cap stocks is now lower than at any other time in this bull market and has declined to slightly below average since 1995. Third, historically, small-cap stocks have done poorly during periods of disinflation and much better during years of re-inflation. We expect the deflation scare of 2014 to give way to a global economic bounce” this year which should be much more hospitable for small company stocks. Finally, although small-cap stocks have struggled during years when the Fed first initiates tightening, their recent underperformance suggests they may do well despite the Fed beginning to normalize interest rates.
Investors should consider augmenting exposure to an asset class which is currently under-owned and significantly out of favor, which has recently declined to its cheapest relative valuation of the recovery and which is likely to soon begin enjoying a much more hospitable economic environment (i.e., re-inflation).
Bottom line: For now, I would stay invested because the Ivy Portfolio market-timing system based on the 10-month moving average remains on a “buy” signal for U.S. stocks, foreign stocks, bonds, and real estate (only sell is commodities).
Roadrunner Stocks Relative Performance
The small-cap comeback has arrived! For the first time in a year (since March 2014), small-cap stocks have outperformed the S&P 500 in a majority of Roadrunner time periods! Specifically, small caps have outperformed in 16 or the 25 Roadrunner time periods, or 64% of the time. Interestingly, small-cap momentum is the star having been the best-performing equity style of the three equity styles (large-cap, small-cap value, and small-cap momentum) for all ten of the most recent time periods.
A 10-period winning streak is quite impressive and demonstrates the importance of investing in both value and momentum. As I explained in the initial January 2013 Roadmap article entitled Your Destination to Profits, the best long-term investment results will be achieved from a diversified portfolio consisting of both value and momentum stocks. A 50-50 allocation to value and momentum is the “holy grail” of investing.
.
Comparative Index Total Return Thru March 13th
Roadrunner Issue Start Date | S&P 500 ETF (SPY) | Vanguard Small-Cap Value (VBR) | PowerShares DWA SmallCap Momentum (DWAS) | Advantage |
January 24th, 2013 | 43.28% | 44.30% | 44.06% | Small-cap Value |
February 27th, 2013 | 40.93% | 41.16% | 40.43% | Small-cap Value |
March 28th, 2013 | 36.04% | 35.05% | 31.51% | Large cap |
April 26th, 2013 | 34.69% | 36.73% | 32.78% | Small-cap Value |
May 24th, 2013 | 28.93% | 30.73% | 26.62% | Small-cap Value |
June 28th, 2013 | 32.16% | 32.55% | 26.32% | Small-cap Value |
July 29th, 2013 | 25.76% | 24.83% | 17.48% | Large cap |
September 3rd, 2013 | 28.97% | 29.33% | 17.55% | Small-cap Value |
October 1st, 2013 | 24.59% | 21.47% | 9.60% | Large cap |
November 4th, 2013 | 19.31% | 17.21% | 9.92% | Large cap |
December 2nd, 2013 | 16.87% | 15.48% | 6.02% | Large cap |
January 6th, 2014 | 15.07% | 13.43% | 5.73% | Large cap |
January 30th, 2014 | 17.08% | 14.57% | 6.39% | Large cap |
March 4th, 2014 | 11.87% | 8.27% | -0.74% | Large cap |
April 3rd, 2014 | 10.76% | 7.08% | 5.06% | Large cap |
May 6th, 2014 | 11.85% | 10.36% | 15.53% | Small-cap Momentum |
June 5th, 2014 | 7.44% | 5.63% | 10.03% | Small-cap Momentum |
July 7th, 2014 | 5.27% | 3.32% | 5.76% | Small-cap Momentum |
August 7th, 2014 | 8.85% | 8.59% | 14.15% | Small-cap Momentum |
September 10th, 2014 | 3.93% | 3.76% | 8.18% | Small-cap Momentum |
October 10th, 2014 | 8.62% | 13.90% | 21.75% | Small-cap Momentum |
November 11th, 2014 | 1.36% | 3.22% | 8.15% | Small-cap Momentum |
December 15th, 2014 | 3.73% | 6.60% | 11.49% | Small-cap Momentum |
January 13th, 2015 | 1.85% | 3.86% | 7.17% | Small-cap Momentum |
February 18, 2015 | -2.05% | -0.72% | 3.04% | Small-cap Momentum |
Source: Bloomberg
More than half (21 out of 40) of Roadrunner recommendations have outperformed their respective small-cap benchmarks and both the Value and Momentum portfolios have a positive double-digit average return. The Value Portfolio shows 10 out of 20 holdings (50%) outperforming VBR and sports an average return of 19.97%, 2.71 percentage points better than VBR. In contrast, the Momentum Portfolio has 11 of its 20 holdings (55%) outperforming DWAS and sports an average return of 25.02%, 12.99 percentage points better than DWAS.
Performance Scorecard
Overall, 27 of 40 Roadrunner holdings (67.5%) have generated positive absolute returns. Below, each Roadrunner portfolio lists the best relative performers in descending order:
Value Portfolio
(thru March 13th)
Roadrunner Stock | Start Date | Roadrunner Performance | Vanguard Small-Cap Value (VBR) | Roadrunner Outperformance? |
Diamond Hill Investment Group (DHIL) | 1-24-13 | 119.72% | 44.30% | +75.42% |
Brocade Communications (BRCD) | 2-27-13 | 115.63% | 41.16% | +74.47% |
Gentex (GNTX) | 1-24-13 | 93.83% | 44.30% | +49.53% |
U.S. Ecology (ECOL) | 9-3-13 | 77.34% | 29.33% | +48.01% |
Alliance Fiber Optic Products (AFOP) | 11-11-14 | 31.47% | 3.22% | +28.25% |
W.R. Berkley (WRB) | 3-04-14 | 26.89% | 8.27% | +18.62% |
Werner Enterprises (WERN) | 4-03-14 | 24.44% | 7.08% | +17.36% |
Lattice Semiconductor (LSCC) | 2-18-15 | 8.81% | -0.72% | +9.53% |
Harte-Hanks (HHS) | 12-15-14 | 10.66% | 6.60% | +4.06% |
Stewart Information Services (STC) | 10-1-13 | 22.38% | 21.47% | +0.91% |
Weyco Group (WEYS) | 1-30-14 | 10.51% | 14.57% | -4.06% |
Vishay Precision Group (VPG) | 10-10-14 | 2.65% | 13.90% | -11.25% |
Exactech (EXAC) | 11-4-13 | 1.59% | 17.21% | -15.62% |
Sanderson Farms (SAFM) | 7-7-14 | -17.36% | 3.32% | -20.68% |
FutureFuel (FF) | 3-28-13 | 12.56% | 35.05% | -22.49% |
AGCO Corp. (AGCO) | 5-6-14 | -13.22% | 10.36% | -23.58% |
Rayonier Advanced Materials (RYAM) | 1-13-15 | -26.05% | 3.86% | -29.91% |
Gulf Island Fabrication (GIFI) | 6-05-14 | -32.09% | 5.63% | -37.72% |
RPC Inc. (RES) | 9-10-14 | -42.95% | 3.76% | -46.71% |
Stepan Co. (SCL) | 6-28-13 | -27.43% | 32.55% | -59.98% |
20-Stock Averages |
| 19.97% | 17.26% | 2.71% |
Momentum Portfolio
(thru March 13th)
Roadrunner Stock | Start Date | Roadrunner Performance | PowerShares DWA SmallCap Momentum (DWAS) | Roadrunner Outperformance? |
G-III Apparel (GIII) | 5-24-13 | 155.65% | 26.62% | +129.03% |
U.S. Physical Therapy (USPH) | 4-26-13 | 108.16% | 32.78% | +75.38% |
Vipshop Holdings (VIPS) | 5-6-14 | 73.81% | 15.53% | +58.28% |
VCA Inc. (WOOF) | 4-03-14 | 56.11% | 5.06% | +51.05% |
Hill-Rom Holdings (HRC) | 9-3-13 | 44.84% | 17.55% | +27.29% |
Apogee Enterprises (APOG) | 11-4-13 | 36.16% | 9.92% | +26.24% |
Marcus & Millichap (MMI) | 8-7-14 | 36.97% | 14.15% | +22.82% |
Chase Corp. (CCF) | 1-30-14 | 26.97% | 6.39% | +20.58% |
China Biologic Products (CBPO) | 1-13-15 | 22.72% | 7.17% | +15.55% |
CBOE Holdings (CBOE) | 1-6-14 | 18.74% | 5.73% | +13.01% |
The Ensign Group (ENSG) | 2-18-15 | 5.45% | 3.04% | +2.41% |
Platform Specialty Products (PAH) | 11-11-14 | 4.52% | 8.15% | -3.63% |
Taro Pharmaceutical (TARO) | 12-15-14 | 6.56% | 11.49% | -4.93% |
OmniVision Technologies (OVTI) | 11-11-14 | -2.16% | 8.15% | -10.31% |
Gentherm (THRM) | 9-10-14 | -8.64% | 8.18% | -16.82% |
EQT Midstream Partners L.P. (EQM) | 8-7-14 | -10.35% | 14.15% | -24.50% |
Anika Therapeutics (ANIK) | 6-5-14 | -17.27% | 10.03% | -27.30% |
NuStar GP Holdings (NSH) | 8-7-14 | -13.29% | 14.15% | -27.44% |
The Greenbrier Companies (GBX) | 9-10-14 | -21.19% | 8.18% | -29.37% |
BitAuto Holdings (BITA) | 8-7-14 | -23.34% | 14.15% | -37.49% |
20-Stock Averages |
| 25.02% | 12.03% | 12.99% |
Correlation Analysis
Please note: The goal of the Momentum Portfolio will be that all short-term stock holdings move in the same positive direction at the same time. Consequently, I only provide correlation data for the Value Portfolio (long-term focus).
The Value Portfolio Front Runner this month – NMI Holdings (NMIH) — provides low correlation with the other existing holdings. Using a stock correlation calculator, I created a correlation matrix for the Roadrunner Value Portfolio, including this month’s recommendation of NMI Holdings (NMIH). The time frame for the correlations was daily measuring periods over three years:
Value Portfolio 3-Year Correlations
NMIH | |
AFOP | 0.380 |
BRCD | 0.372 |
DHIL | 0.255 |
ECOL | -0.026 |
EXAC | -0.046 |
FF | 0.072 |
GIFI | 0.203 |
GNTX | 0.086 |
HHS | 0.319 |
LSCC | 0.062 |
RES | 0.104 |
RYAM | 0.040 |
SAFM | -0.179 |
SCL | 0.193 |
STC | 0.222 |
VPG | 0.209 |
WERN | 0.013 |
WEYS | 0.248 |
WRB | 0.154 |
As you can see above, NMI Holdings provides decent, if mixed, diversification benefits to the Value Portfolio. Based on my portfolio analysis software, after deleting agricultural equipment manufacturer AGCO Corp., the Value Portfolio was equal-weight the “financial services” sector and extremely underweight (i.e., zero exposure) the “speculative growth” stock type, so adding another cyclical financial services company doesn’t do anything for sector diversification, but provides a huge benefit in stock-type diversification.
Given NMI Holdings’ undervaluation, growth prospects, and insider buying, I’m okay with additional financial services and cyclical exposure right now at a time when interest rates are low and U.S. housing is in an upswing. Sometimes short-term “tactical” asset allocation that results in overweights trumps long-term “strategic” asset allocation based on equal-weights. And the “speculative” stock type that NMI Holdings provides is critically needed by the Value Portfolio.
Value Portfolio Composition After AGCO Corp. is Sold
But Before NMI Holdings is Added
Industry Sector | Roadrunner Value Portfolio | Mid/Small Cap Benchmark | |
Cyclical | 47.39 | 40.89 | |
Basic Materials | 15.80 | 5.19 | |
Consumer Cyclical | 15.77 | 15.65 | |
Financial Services | 15.82 | 15.07 | |
Real Estate | 0 | 4.98 | |
Sensitive | 42.05 | 40.31 | |
Communication Services | 0 | 1.30 | |
Energy | 10.51 | 5.40 | |
Industrials | 10.52 | 17.29 | |
Technology | 21.02 | 16.33 | |
Defensive | 10.57 | 18.77 | |
Consumer Defensive | 5.28 | 4.63 | |
Healthcare | 5.28 | 11.43 | |
Utilities | 0 | 2.71 |
Stock Type | Roadrunner Value Portfolio | Mid/Small Cap Benchmark | |
High Yield | 5.26 | 0.98 | |
Distressed | 0 | 2.57 | |
Hard Asset | 10.51 | 9.04 | |
Cyclical | 52.63 | 51.73 | |
Slow Growth | 5.26 | 10.22 | |
Classic Growth | 10.54 | 5.57 | |
Aggressive Growth | 15.80 | 9.43 | |
Speculative Growth | 0 | 5.87 | |
Not Classified | 0 | 4.60 |
Source: Morningstar
NMI Holdings has a very low correlation with Sanderson Farms (SAFM) and Exactech (EXAC) because mortgage insurance outperforms during strong growth in home purchases, whereas chicken and joint replacements are defensive businesses that do well regardless of the economy.
Looking at the correlation matrix below, the best diversifiers are those with a lot of red shadings. If you don’t already own poultry-processor Sanderson Farms (SAFM), or energy services firm Gulf Island Fabrication (GIFI) in the Value Portfolio, now would be a good time to pick up some shares as both are currently trading at a buyable price level.
A total correlation matrix is shown below:
Value Portfolio

Stock Talk
Add New Comments
You must be logged in to post to Stock Talk OR create an account