Stock Market Correction is a Large-Cap Affair Based on Foreign Uncertainty
Market Outlook
A picture is worth 1000 words and I’ve got two pictures that say it all:
In the first picture, the S&P 500 at the close in August 2015 is in a precarious position similar to September 2000 and November 2007 in so far as the index closed below both the 10-month and 12-month moving averages. Bear markets always start with a stock-index close under these monthly moving averages, BUT closes under these monthly moving averages occur much more frequently than bear markets do (i.e., many false positives).
Skeptics point out that monthly moving average crossunders occurred in June 2010 and August 2011 without any subsequent bear markets, but the faithful retort that the 2010 and 2011 occurrences don’t count because the monthly moving averages were in an ascending trend during those crossunders (i.e., the monthly moving average in the month of crossunder was higher than the monthly moving average in the previous month). In contrast, the 2000 and 2007 crossunders occurred with the monthly moving averages in a declining trend. This time around in 2015, the monthly moving averages are in a declining trend similar to the 2000 and 2007 precedents and dissimilar to the 2010 and 2011 precedents. Uh oh. As of now, no evidence of a bullish turnaround.
In the second picture, 10 out of the 12 instances when the S&P 500 hit a 12-month low in August, this August low was undercut before the end of the calendar year. That’s the bad news. The good news is that 8 out of the 12 instances saw the S&P 500 rise in value between September and the end of the calendar year, suggesting that even if the August low is broken to the downside in September or October, that a strong year-end rally will carry stocks above the closing price in August by an average of 3.1%. A rally seems likely since I can’t forget that 2015 ends with a “5”and stocks have risen in every “5” year since 1875, which was 140 years ago.
Bear markets rarely start in earnest immediately after the initial crossunder the monthly moving averages. Rather, the initial crossunder causes investor panic and extreme bearish sentiment that marks the end of a first leg down. We are seeing extreme bearish sentiment right now, the most bearish sentiment in 15 years, which suggests that this initial down leg is almost over. I say “almost over” because bearish investor sentiment typically peaks before stock prices bottom because it takes time for investors to act (i.e., sell) on their feelings. Keep in mind also that investors could be saying one thing and doing another:
- Small speculators (i.e., dumb money) in stock index futures are the most bearish in history and in volatility (VIX) futures the most bullish in history, suggesting “the mother of all short squeezes” is around the corner.
- Commercial hedgers (i.e., smart money) in stock index futures are the most bullish in history.
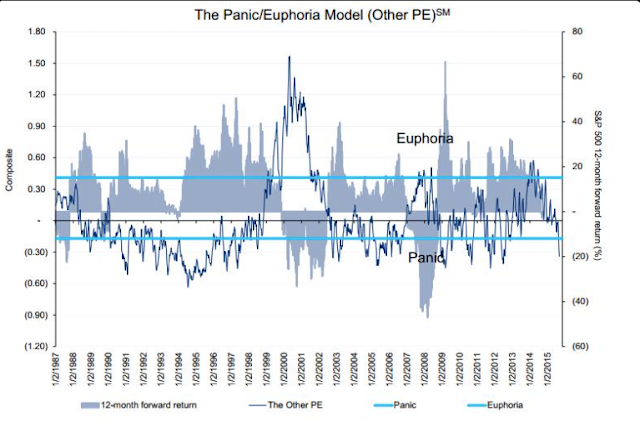
- The Citibank Panic/Euphoria model indicates that investors are at ‘panic’ levels (-0.44). The most recent comparable times were June 2012 and October 2011, both lows in equities. When ‘panic’ has been at current levels in the past 30 years, equities were higher 12-months later 96% of the time. Notice that the 2000-02 and the 2007-08 bear markets were NOT periods where the model indicated ‘panic’.
- Equity outflows are staggering and continuous, indicating “total capitulation.”
- Investors Intelligencebulls are the lowest in five years and the correction camp is over 45% – the highest level since last October, which was the highest in 19 years.
- The National Association of Active Investment Managers (NAAIM) Exposure Index, which measures fund manager allocation to U.S, stocks, dropped to 23.85 on September 2nd, the lowest reading since the October 15, 2014 lows – which was a great time to buy stocks.
- The S&P 500 volatility index (VIX) closed on August 24th at its highest level since October 2011 and hit an intraday high above 50 for the first time since March 2009 (6 ½ years ago).
- CBOE equity put/call ratio is near a six-year high.
After such extreme bearish sentiment readings, a stock-market rally typically ensues either to new all-time highs (e.g., October 2007) or at least to a close above the monthly moving averages. According to Jason Goepfert of Sentimentrader.com, the back-to-back strong stock-market rallies with 80% up volume on August 26th and August 27th after the August 24th market low qualify as “breadth thrusts” that have historically led to an intermediate-term market rebound:
Goepfert went back to look for other times that the 10-day average of Up Volume was oversold (below 45%), then there were back-to-back days of at least 80% Up Volume. He also separated out those instances when the 10-day average was the most oversold heading into the up thrust.
Goepfert’s data shows that the dates that most closely mirror our current situation were 30-Oct-1962, 30-Oct-1987, 29-Nov-1971 and 18-Dec-2014. Those were the dates when the 10-day and 5-day averages were the most oversold, and the back-to-back days of Up Volume were the most impressive. Stocks struggled in the month after the 1987 and 2014 occurrences but did very well in the months after that.
In summary, the type of trading seen Aug. 26-27 is what bulls would like to see. It has not been foolproof (big fail in 2008) but when you see a historic level of panic followed by multiple days of aggressive buying pressure, it has almost always led to intermediate-term gains.
One reason that the expected market rebound may not begin immediately is because there are several hedge funds that engage in complex leveraged strategies such as “risk parity” that blew up in late August with the unexpected increase in market volatility and unwinding (i.e., selling) these leveraged strategies takes time. JP Morgan estimates that the liquidation of these leveraged positions will continue to put downward pressure on the stock market until the beginning of October.
If the stock-market rebound that ensues after this forced hedge-fund liquidation is over fails to hold and a new down leg begins, this second down leg in the market would be the real indication that a bear market had begun in earnest. The percentage of U.S. household wealth held in stocks is near a 15-year high, so there is a lot of retail selling that could occur if panic sets in. On the other hand, retail investors are less prone to engage in panic selling than institutions, so a high retail percentage may be a good thing. Let me stress that we have not even experienced the initial rebound yet, so it is far too premature of a stock pattern to reach any definitive conclusion as to the intermediate-term direction of the market. What I can say is that caution is in order.
The stock market is indecisive, buffeted by technical breakdowns and fundamental overvaluation some characterize as “frothy” pushing the market down and extreme bearish investor sentiment and a strengthening U.S. economy pushing the market up. Investor indecisiveness is of historic proportions, as the weekly close of the S&P 500 has alternated up and down for 11 consecutive weeks – a record only matched two other times in market history (1977 and 1994). In both of those prior cases, the stock market went nowhere for the subsequent seven weeks.
The U.S. economy continues to experience modest growth. Second-quarter GDP was revised higher to 3.9%, up from an already-strong 3.7%. As Urban Carmel puts it:
Our view is that the economy is not nearing a recession: employment growth is the best since the 1990s, housing demand is the best in 8 years and household balance sheets are among the best of the past 30 years (chart below). It’s not all perfect but the balance of evidence is positive.
Despite the positive U.S. economic data, the Federal Reserve decided not to hike interest rates at its September 17th policy meeting, stating “recent global economic and financial developments may restrain economic activity somewhat and are likely to put further downward pressure on inflation in the near term.” Traders are now not expecting the first rate hike until January. The Fed has never raised rates in a year where the stock market is down year-to-date, but in a September 24th speech Fed Chairman Janet Yellen reiterated her expectation of a rate hike before year’s end based on her assessment that the the U.S. economy remains strong despite turbulence and weakness in foreign economies. A health scare involving 69-year-old Yellen is an added uncertainty.
The stock market initially rallied on news that the Fed wasn’t raising rates, but then changed its mind and reversed back down on fears that the Fed’s rate-hike hesitance reflects knowledge of global economic weakness that could crimp corporate profits. Indeed, several economic indicators that the Fed monitors (10-year Treasury yield, the TED spread, the spread between BBB rated bonds and the 10-year note, average earnings per share, and a trade-weighted dollar index) are much weaker than expected and Minneapolis Federal Reserve Bank President Narayana Kocherlakota actually wants the Fed to cut rates to negative.
Citigroup is bearish on the economy, stating that there is a 55% (i.e., likely) chance of a global recession in 2016, which will be attributable to recession-like weakness in China and emerging markets. Bear markets almost never occur without an economic recession and there is no current indication of an economic recession in the United States. One warning sign involves corporate profits. Standard & Poor’s forecasts that S&P 500 operating earnings will decline by 4.2% in the third quarter, which would be the first year-over-year decline in quarterly operating earnings since the fourth quarter of 2009. According to Sam Stovall of Standard & Poor’s, full-year 2015 operating earnings are also expected to show a slight decline and the S&P 500 has only experienced an annual decline in earnings growth that did not result in a recession three times. We have more than three months to go before full-year 2015 earnings will be known, however, so no need to panic about a recession yet.
The million-dollar question is whether the U.S. can remain immune to the economic weakness elsewhere in the world or whether the foreign weakness will eventually infect the U.S. economy. If Citigroup is right about likely global infection, then a U.S. bear market will follow, but there is always the chance that U.S. economic strength could be powerful enough to improve growth in the rest of the world rather than the other way round.
In the absence of a recession, the U.S. stock market should post double-digit gains over the next 12 months. Shorter-term, Urban Carmel is extremely bullish and expects a year-end rally for the following reasons:
- Most bear markets coincide with a looming recession. The balance of economic evidence is positive.
- US equities have risen 80-100% in the past 3 years, and indices have been higher every year for six years in a row. This has been a strong uptrend.
- Corrections within bull markets are normal. For context, this is the first correction in more than 3 years. Again, the uptrend has been strong. Bull markets do not end with the first correction in several years.
- When price falls, the price pattern looks scary and breadth looks terrible. Stories in the media emphasize the risks of investing. These are when longer term lows form. More likely than not, that is where equity markets are now.
- After waterfall events like that in August, indices will often rally as much as 10% and also retest their lows a month later. That is the pattern we are witnessing now. It’s not hard to imagine that this process will continue into October.
- On a year-end view, the washout in breadth and bearish sentiment provides an attractive risk/reward to accumulate equities on sell offs near the August low.
Of the 11 “waterfall” declines (i.e., 10% or greater decline within 10 days) since 1950 (prior to this year’s waterfall decline ending on August 24th), nine formed a final low within a few percent of the original low. On average, the final low was 27 trading days after the original low; that implies a final low this time around Friday October 2nd.
Bottom line: For now, I would be cautious with equity exposure because the Ivy Portfolio market-timing system based on the 10-month moving average has triggered a “sell” signal for U.S. stocks, U.S. Treasury bonds, foreign stocks, real estate, and commodities. Cash is king, although bearish investor sentiment is so extreme that a snap-back rally is likely in the short term.
Roadrunner Stocks Relative Performance
Despite the stock-market carnage over the past month since mid-August, small caps are more than holding their own against the large caps (this past week ending September 25th was the exception). In fact, small-cap outperformance has moved back up to 57% of the time as of September 4th (17 of 30 Roadrunner time periods), up from 45% of the time as of July 31st (13 of 29 time periods).
All of the most-recent 15 time periods have experienced small-cap outperformance over large caps, with small-cap value taking the lead in the last period away from small-cap momentum for the first time, breaking momentum’s 14-period winning streak. In last month’s Roadrunner issue, I argued that momentum’s complete dominance over value was “unlikely to last much longer” and the resurgence of value last month is the first sign that a reversion to the mean may be starting. Value stocks outperform during economic strength so perhaps “fears” of an interest–rate hike by the Federal Reserve is a catalyst for small-cap value because the Fed will only hike rates if the U.S. economy is strengthening.
I continue to advocate the diversification benefits of investing in both the value and momentum equity styles. As I explained in the initial January 2013 Roadmap article entitled Your Destination to Profits, the best long-term investment results will be achieved from a diversified portfolio consisting of both value and momentum stocks. A 50-50 allocation to value and momentum is the “holy grail” of investing.
Comparative Index Total Return
(Thru September 4th)
Roadrunner Issue Start Date | S&P 500 ETF (SPY) | Vanguard Small-Cap Value (VBR) | PowerShares DWA SmallCap Momentum (DWAS) | Advantage |
January 24th, 2013 | 35.32% | 33.91% | 37.09% | Small-cap Momentum |
February 27th, 2013 | 33.09% | 30.99% | 33.63% | Small-cap Momentum |
March 28th, 2013 | 28.48% | 25.32% | 25.15% | Large cap |
April 26th, 2013 | 27.20% | 26.88% | 26.36% | Large cap |
May 24th, 2013 | 21.76% | 21.32% | 20.49% | Large cap |
June 28th, 2013 | 24.82% | 23.00% | 20.21% | Large cap |
July 29th, 2013 | 18.77% | 15.84% | 11.80% | Large cap |
September 3rd, 2013 | 21.80% | 20.01% | 11.86% | Large cap |
October 1st, 2013 | 17.66% | 12.72% | 4.30% | Large cap |
November 4th, 2013 | 12.68% | 8.77% | 4.61% | Large cap |
December 2nd, 2013 | 10.37% | 7.16% | 0.89% | Large cap |
January 6th, 2014 | 8.68% | 5.26% | 0.62% | Large cap |
January 30th, 2014 | 10.57% | 6.31% | 1.25% | Large cap |
March 4th, 2014 | 5.65% | 0.47% | -5.54% | Large cap |
April 3rd, 2014 | 4.60% | -0.63% | -0.02% | Large cap |
May 6th, 2014 | 5.64% | 2.41% | 9.94% | Small-cap Momentum |
June 5th, 2014 | 1.47% | -1.98% | 4.71% | Small-cap Momentum |
July 7th, 2014 | -0.58% | -4.12% | 0.64% | Small-cap Momentum |
August 7th, 2014 | 2.80% | 0.77% | 8.63% | Small-cap Momentum |
September 10th, 2014 | -1.85% | -3.72% | 2.95% | Small-cap Momentum |
October 10th, 2014 | 2.58% | 5.70% | 15.86% | Small-cap Momentum |
November 11th, 2014 | -4.27% | -4.22% | 2.92% | Small-cap Momentum |
December 15th, 2014 | -2.03% | -1.08% | 6.10% | Small-cap Momentum |
January 13th, 2015 | -3.81% | -3.62% | 1.99% | Small-cap Momentum |
February 18, 2015 | -7.49% | -7.88% | -1.94% | Small-cap Momentum |
March 19, 2015 | -7.21% | -8.85% | -7.00% | Small-cap Momentum |
April 29, 2015 | -8.09% | -9.40% | -3.89% | Small-cap Momentum |
June 1, 2015 | -8.53% | -9.41% | -4.97% | Small-cap Momentum |
July 8, 2015 | -5.84% | -6.71% | -3.55% | Small-cap Momentum |
August 17, 2015 | -8.55% | -7.40% | -8.00% | Small-cap Value |
Source: Bloomberg
More than half (24 out of 40) of Roadrunner recommendations have outperformed their respective small-cap benchmarks and, while the Value Portfolio has dropped below the double-digit average return mark thanks to the overall market downturn, the Momentum portfolios has continued to achieve tremendously positive double-digit percentage average returns. The Value Portfolio shows 10 out of 20 holdings (50%) outperforming VBR and sports an average return of 4.77%, 1.58 percentage points better than VBR. In contrast, the Momentum Portfolio has 14 of its 20 holdings (70%) outperforming DWAS and sports an average return of 32.19%, blowing away DWAS by an astounding 27.84 percentage points.
Interestingly, the momentum index has outperformed the value index by only 1.16 percentage points (4.35% vs. 3.19%), but Roadrunner’s Momentum Portfolio has outperformed the Value Portfolio by 27.42 percentage points (32.19% vs. 4.77%). When individual momentum stocks outperform an index, they REALLY outperform!
Performance Scorecard
Overall, 20 of 40 Roadrunner holdings (50%) have generated positive absolute returns compared to 22 of 40 time periods by the two small-cap indices. The fact that both Roadrunner portfolios are beating their benchmarks despite having a lower percentage of positive-return periods demonstrates that the individual winning stocks in the portfolios outperform the benchmark indices by a large margin and overwhelm the lower-percentage of winning periods.
This is another illustration of the importance of small-cap diversification: only by purchasing the entire portfolio can one ensure holding the minority of stocks that outperform by a large margin and which enable the Roadrunner portfolios to outperform their benchmarks.
Below, each Roadrunner portfolio lists the best relative performers in descending order:
Value Portfolio
(thru September 4th)
Roadrunner Stock | Start Date | Roadrunner Performance | Vanguard Small-Cap Value (VBR) | Roadrunner Outperformance? |
Diamond Hill Investment Group (DHIL) | 1-24-13 | 187.09% | 33.91% | +153.18% |
U.S. Ecology (ECOL) | 9-3-13 | 79.86% | 20.01% | +59.85% |
Alliance Fiber Optic Products (AFOP) | 11-11-14 | 41.42% | -4.22% | +45.64% |
Gentex (GNTX) | 1-24-13 | 73.53% | 33.91% | +39.62% |
W.R. Berkley (WRB) | 3-04-14 | 34.18% | 0.47% | +33.71% |
NMI Holdings (NMIH) | 3-19-15 | 10.90% | -8.85% | +19.75% |
Utah Medical Products (UTMD) | 8-17-15 | -1.28% | -7.40% | +6.12% |
MSC Industrial Direct (MSM) | 6-1-15 | -4.82% | -9.41% | +4.59% |
Weis Markets (WMK) | 7-08-15 | -2.97% | -6.71% | +3.74% |
SJW Corp. (SJW) | 4-29-15 | -6.18% | -9.40% | +3.22% |
Weyco Group (WEYS) | 1-30-14 | 5.10% | 6.31% | -1.21% |
Vishay Precision Group (VPG) | 10-10-14 | -17.74% | 5.70% | -23.44% |
Lattice Semiconductor (LSCC) | 2-18-15 | -33.87% | -7.88% | -25.99% |
Sanderson Farms (SAFM) | 7-7-14 | -31.08% | -4.12% | -26.96% |
Exactech (EXAC) | 11-4-13 | -18.26% | 8.77% | -27.03% |
Gulf Island Fabrication (GIFI) | 6-05-14 | -39.44% | -1.98% | -37.46% |
Harte-Hanks (HHS) | 12-15-14 | -42.53% | -1.08% | -41.45% |
Stepan Co. (SCL) | 6-28-13 | -21.72% | 23.00% | -44.72% |
RPC Inc. (RES) | 9-10-14 | -49.19% | -3.72% | -45.47% |
Rayonier Advanced Materials (RYAM) | 1-13-15 | -67.65% | -3.62% | -64.03% |
20-Stock Averages |
| 4.77% | 3.19% | 1.58% |
Momentum Portfolio
(thru September 4th)
Roadrunner Stock | Start Date | Roadrunner Performance | PowerShares DWA SmallCap Momentum (DWAS) | Roadrunner Outperformance? |
G-III Apparel (GIII) | 5-24-13 | 236.54% | 20.49% | +216.05% |
U.S. Physical Therapy (USPH) | 4-26-13 | 95.03% | 26.36% | +68.67% |
Marcus & Millichap (MMI) | 8-7-14 | 74.19% | 8.63% | +65.56% |
VCA Inc. (WOOF) | 4-03-14 | 62.04% | -0.02% | +62.06% |
Apogee Enterprises (APOG) | 11-4-13 | 64.95% | 4.61% | +60.34% |
Hill-Rom Holdings (HRC) | 9-3-13 | 52.68% | 11.86% | +40.82% |
China Biologic Products (CBPO) | 1-13-15 | 42.58% | 1.99% | +40.59% |
CBOE Holdings (CBOE) | 1-6-14 | 27.85% | 0.62% | +27.23% |
Concordia Healthcare (CXRX) | 7-08-15 | 19.46% | -3.55% | +23.01% |
Paycom Software (PAYC) | 4-29-15 | 13.50% | -3.89% | +17.39% |
Chase Corp. (CCF) | 1-30-14 | 18.27% | 1.25% | +17.02% |
The Ensign Group (ENSG) | 2-18-15 | 14.79% | -1.94% | +16.73% |
Multi-Color Corp. (LABL) | 6-1-15 | -2.42% | -4.97% | +2.55% |
Vipshop Holdings (VIPS) | 5-6-14 | 11.44% | 9.94% | +1.50% |
Taro Pharmaceutical (TARO) | 12-15-14 | -2.26% | 6.10% | -8.36% |
OmniVision Technologies (OVTI) | 11-11-14 | -6.19% | 2.92% | -9.11% |
EQT Midstream Partners L.P. (EQM) | 8-7-14 | -5.33% | 8.63% | -13.96% |
Gentherm (THRM) | 9-10-14 | -12.23% | 2.95% | -15.18% |
Ambarella (AMBA) | 8-17-15 | -32.63% | -8.00% | -24.63% |
Platform Specialty Products (PAH) | 11-11-14 | -28.55% | 2.92% | -31.47% |
20-Stock Averages |
| 32.19% | 4.35% | 27.84% |
Correlation Analysis
Please note: The goal of the Momentum Portfolio will be that all short-term stock holdings move in the same positive direction at the same time. Consequently, I only provide correlation data for the Value Portfolio (long-term focus).
The Value Portfolio Front Runner this month – DSW Inc. (DSW) — provides low correlation with the other existing holdings. Using a stock correlation calculator, I created a correlation matrix for the Roadrunner Value Portfolio, including this month’s recommendation of DSW Inc. (DSW).
Value Portfolio 3-Year Correlations
DSW | |
AFOP | -0.148 |
DHIL | 0.333 |
ECOL | 0.126 |
EXAC | 0.320 |
GIFI | 0.422 |
GNTX | 0.371 |
HHS | 0.247 |
LSCC | 0.109 |
MSM | 0.502 |
NMIH | 0.339 |
RES | 0.281 |
SAFM | 0.165 |
SCL | 0.418 |
SJW | 0.421 |
UTMD | 0.234 |
VPG | 0.403 |
WEYS | 0.374 |
WMK | 0.441 |
WRB | 0.490 |
As you can see above, DSW Inc. provides decent diversification benefits to the Value Portfolio. Based on my portfolio analysis software, after deleting cellulose manufacturer Rayonier Advanced Materials, the Value Portfolio was equal weight the “consumer cyclical” sector and was severely underweight the “cyclical” stock type. DSW Inc. is both consumer cyclical and cyclical, so adding this stock helps diversify the portfolio in one important way (stock type). On the other hand, DSW is another shoe retailer similar to Weyco Group (WEYS), so I’m over-weighting the footwear sub-sector, but Weyco focuses on high-end footwear (e.g., BOGS boots) whereas DSW is a discounter.
Value Portfolio Composition After Rayonier Advanced Materials is Sold
But Before DSW Inc. is Added
Industry Sector | Roadrunner Value Portfolio | Mid/Small Cap Benchmark | |
Cyclical | 36.84 | 40.89 | |
Basic Materials | 5.26 | 5.19 | |
Consumer Cyclical | 15.79 | 15.65 | |
Financial Services | 15.79 | 15.07 | |
Real Estate | 0 | 4.98 | |
Sensitive | 36.84 | 40.31 | |
Communication Services | 0 | 1.30 | |
Energy | 10.55 | 5.40 | |
Industrials | 10.50 | 17.29 | |
Technology | 15.79 | 16.33 | |
Defensive | 26.33 | 18.77 | |
Consumer Defensive | 10.50 | 4.63 | |
Healthcare | 10.55 | 11.43 | |
Utilities | 5.27 | 2.71 |
Stock Type | Roadrunner Value Portfolio | Mid/Small Cap Benchmark | |
High Yield | 5.28 | 0.98 | |
Distressed | 0 | 2.57 | |
Hard Asset | 10.55 | 9.04 | |
Cyclical | 36.82 | 51.73 | |
Slow Growth | 10.52 | 10.22 | |
Classic Growth | 10.55 | 5.57 | |
Aggressive Growth | 21.02 | 9.43 | |
Speculative Growth | 5.26 | 5.87 | |
Not Classified | 0 | 4.60 |
Source: Morningstar
DSW Inc. has a very low correlation with technology companies Alliance Fiber Optic Products (AFOP) and Lattice Semiconductor (LSCC) because, even though all of these companies are cylical, women’s shoes are consumer items that ebb and flow to a completely different temporal cycle than electrical components sold to businesses. DSW Inc. also has low correlation with Sanderson Farms (SAFM) because . . . well, chicken processing appears to be in its own clucky world and exhibits low correlation with almost every other stock regardless of industry sector! That’s why I keep Sanderson Farms around.
Looking at the correlation matrix below, the best diversifiers are those with a lot of red shadings. If you don’t already own electronic equipment manufacturer Vishay Precision Group (VPG), energy services firm Gulf Island Fabrication (GIFI), or orthopedic device manufacturer Exactech (EXAC) in the Value Portfolio, now would be a good time to pick up some shares as all three are currently trading at a buyable price level.
A total correlation matrix is shown below:

Stock Talk
Add New Comments
You must be logged in to post to Stock Talk OR create an account