Fed Rate Hike Will Not Derail the Bull Market in Small Caps
Market Outlook
According to Fed Funds futures, there is a 81.4% probability that the Federal Reserve will raise interest rates at its December 16th meeting, which will be the first rate hike in more than nine years (since June 2006). The November jobs report was strong, with 211,000 new jobs created and the employment estimates for the previous two months of September and October both adjusted upwards. Since the jobs report was the last major economic data point prior to the Fed meeting, many analysts now believe that a rate hike is “all but guaranteed.” Fed Chairman Janet Yellen pretty much promised a rate hike at her Congressional testimony on Thursday December 3rd.
One might reasonably expect that the stock market would sell off on the strong jobs report because it ensured that rates will rise, but the opposite happened last Friday – stocks had a huge rally, up 2.1 percent, its strongest gain since Sept. 8th. The S&P 500 has now risen in nine of the past 10 weeks. The reason stocks rallied is that investors are shifting their focus from the inevitable first rate hike to the strength of the economy, which promises higher corporate profits. Historical evidence suggests that stocks perform just fine after a first rate hike:
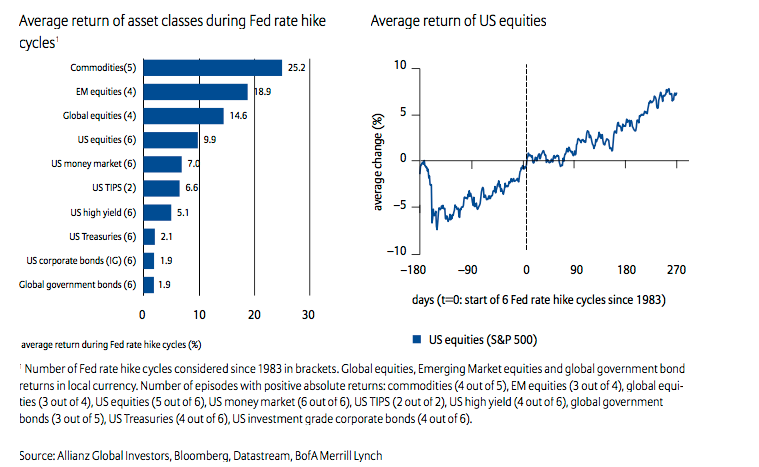
Anticipation of rate hikes can make things volatile for a while. Once the hike hits, though, the impact is not as dramatic. The market over the past 35 years or so is most often up sharply—about 14 percent—heading into the rate hike, fairly flat in the 250 days after (average gain of 2.6 percent) then back to normal once 500 days have passed, with average return in the past six cycles of 14.4 percent.
This time around, however, the stalling effects of the first rate hike may be inapplicable because rates are starting from such an incredibly low level. Raising rates from zero to 0.25% will have no meaningful impact on economic growth, but the fact that the economy is strengthening to justify a rate hike means that corporate profits could skyrocket:
The fed funds rate has room to move higher before it drags on economic growth. For example, if the Fed enacts four or five 25 basis point rate increases over the coming year (a reasonable expectation), the fed funds rate would increase to just 1.0% to 1.25%. This would hardly be punitive by any measure. During the previous six rate hike cycles, the fed funds rate started at an average of about 5%. Put another way, the current economy is probably still weak enough to need low rates—just not quite so low.
A second, and related, implication is that an environment of low and upward moving rates can be a good backdrop for equities. Not surprisingly, equities fared poorly when yields were high and moving higher and performed well when yields were decreasing from elevated levels. Interestingly, stock prices also tended to rise significantly when yields were low and starting to move higher.
Hurting stocks right now is the crash in oil prices, with West Texas Intermediate (WTI) recently hitting a seven-year low under $36 a barrel on news that OPEC has lost control of pricing power. For the first time in decades, OPEC oil ministers dropped any reference to the group’s output ceiling. One commentator interpreted OPEC’s refusal to lower output in the fact of a global supply glut as the end of OPEC:
Lots of people said OPEC was dead. OPEC itself has just confirmed it.
Whether OPEC is dead and gone, the fact remains that plunging oil prices act as a huge tax cut for consumers, which will more than counteract any interest-rate hike from the zero level. Economic growth and corporate profits will benefit from lower oil prices. Energy stocks won’t benefit from low oil prices, but overall the economy benefits because “lower oil prices are a clear net plus because we are bigger consumers than producers.” So why are stocks selling off in tandem with oil prices? According to Wharton finance professor Jeremy Siegel, the collapse in oil prices and a strong U.S. dollar shaved $15 off of S&P 500 earnings for 2015, an “unprecedented decline:”
When people ask, “Well, isn’t lower oil good for the U.S?” The answer is, “Yes. Lower oil is good for the U.S. In fact, even a higher dollar, everything equal, is good for the U.S. It increases purchasing power. It lowers the price of imports and it helps the consumer.”
But the problem is the S&P is not just a U.S. Index. With 40% to 45% of its profits earned abroad, a heavy energy sector and an industrial sector that supplies to the energy sector, anything that pounds energy is going to pound the S&P. That’s why the return on stocks fell so sharply from what I had predicted.
According to hedge-fund energy trader John Arnold: “With few hedges for ’16, half of US energy industry will be bankrupt in 6 months with prices at these levels.” Besides crude oil, other commodities are also weak (CRB commodity index is at 13-year low), with iron ore prices crashing below $40 per ton for the first time ever since spot prices started being reported in May 2009.
Evidence of a modest pickup in economic growth is widespread, not just in the recent job report. As Urban Carmel puts it:
In summary, the major macro data so far suggest positive, but modest, growth. The main positives are in employment, consumption growth and housing.
- Employment growth is close to the best since the 1990s, with an average monthly gain of 220,000 during the past year.
- Compensation growth is near the highest in more than 6 years: 2.3% year-over-year in November.
- Personal consumption growth the last four quarters has been the highest in 8 years. 3Q15 real GDP (less inventory changes) grew 2.1%, near the middle of the post-recession range.
- New housing sales remain near an 8 year high.
The main negatives are concentrated in the manufacturing sector:
- Core durable goods growth fell 2% year-over-year in October. It was weak during the winter and there has been little rebound since. Industrial production has also been weak, growing at just 0.3% year-over-year, one of the lowest rates in the past 15 years.
- The core inflation rate remains under 2%. It is near its lowest level in the past 3 years.
Although weak manufacturing makes the economic outlook mixed, in the information age it is services that drive overall growth, not manufacturing.
Goldman Sachs predicts that the Fed will hike interest rates four times in 2016, which is one reason that Goldman sees stocks stagnating in 2016 and Citigroup believes there is a 65% probability of a recession starting in 2016, but Fed Chairman Yellen dismissed this recession warning, reiterating the Fed’s forecast of 2.3% GDP growth next year on the back of full employment. San Francisco Fed President John Williams is even giddier, arguing in a December 2nd speech:
Dancing days are here again. We’ve made remarkable progress and the economy is on the cusp of full health.
Full employment means that the labor market is tight, which causes wages to rise and there is evidence that wages are strengthening. Better employment plus wage growth = higher personal consumption, which results in stronger corporate profits, which results in more hiring, and the positive feedback loop continues.
Let’s hope this positive feedback loop from employment growth kicks into high gear soon because real corporate earnings for S&P 500 companies are turning down. Third-quarter corporate profits dropped 4.7% year-over-year, the largest annual decline since the second quarter of 2009. Profit weakness is expected to continue in the fourth quarter, dropping another 4.3% year-over-year. When corporate profits decline, companies have less free cash flow to invest in new projects, which can cause economic growth to slow in a negative feedback loop.
Corporate profits may perk up in 2016, however, if the U.S. dollar weakens, which historically (and ironically) has occurred after the Fed starts raising interest rates. Interestingly, the fact that the European Central Bank continues to ease monetary policy does not change the historical tendency of the U.S. dollar to weaken after the Fed hikes rates. Professor Siegel is predicting a “bounce back in earnings” in 2016 after a “terrible year for earnings” in 2015. His reasoning:
All we need is for oil to stabilize at the $40 to $50 level and the dollar to stabilize at $1.05 to $1.10 against the euro for us to get a nice snap back in the earnings.
If earnings bounce back, Siegel predicts the S&P 500 will rise to 2,300. He warns, however, that if his prediction for a bounce back in 2016 earnings does not occur, “we are not going to have a good year in stocks.”
Based on historical precedent, stocks hesitate temporarily at the beginning of rate-hike cycles because of uncertainty over the effect higher rates will have on corporate earnings, but almost always the earnings come through as the stronger economy trumps higher rates. As Urban Carmel puts it:
A rate increase means that the economy is improving enough that employment and inflation are considered to be well on the path to being healthy. You would expect, therefore, that stocks would do well if the Fed felt comfortable raising rates. An improving economy also implies demand for commodities and lower default rates, meaning that commodity prices are rising and high yield bonds are at least stable.
And in fact, this is what usually happens when the Fed raises rates for the first time: stocks and commodities rise and high yield bonds have a positive return over the next year.
The rate hike that is likely to occur on December 16th is the most telegraphed in history. Everyone knows it is going to happen. Market declines occur on negative surprises that have not yet been fully discounted in stock valuations. I believe this rate hike has already been fully discounted into stock valuations and that stocks could actually rally once the news is out. As technician Chris Ciovacco explains:
Given the charts presented here, it is fair to say stocks typically go up after the first rate hike, but not always.
Technically, the S&P 500 just broke out of a symmetrical triangle pattern to the downside, falling 3.8% last week, the largest weekly decline since August, and one that pushed the stock index to a 2.3% loss year-to-date. Until Tuesday Dec. 15th broke the streak, there had not been two consecutive up days in the S&P 500 for 28 consecutive trading sessions, which is the longest streak of negative consistency since 1970. Looking at the 12 other instances of such long-lasting trendless action (23 or more days), subsequent market performance has been below average over the next month (positive only 42% of the time), but then returns to a more normal positive trend (two thirds positive).
December is usually a very bullish month for stocks (page 3) and exhibits very low volatility, but December 2015 has been neither so far. As of December 11th, the S&P 500 is down 3% which is the worst start to December since 2002 and only six years since 1950 have experienced worse first-half Decembers (1957, 1969, 1974, 1975, 1980, 2002) than this year. In four of those previous years, the stocks ended the month of December higher than their mid-month low, so there is hope for a stock rebound this year. In fact, over the past 20 years the first half of December has averaged a loss and generated the entire month’s gain in the second half. The average maximum decline during December is 3.7% and so far in 2015 the decline has been 4.2%, which is only slightly higher than normal.
Sentiment has become very bearish based on the McClellan Oscillator, the CBOE options equity-only put-call ratio, and the VIX rising 63%, all of which from a contrarian viewpoint signify a bottom. Furthermore, the first day of December was up big this year, which has correctly predicted a positive gain for the entire month of December 93.75% of the time. In addition, the S&P 500 cumulative advance-decline line hit an all-time high at the start of December which has almost never marked the top – breath usually peaks before stock prices do. Lastly, the stock chart of 2015 has mirrored the stock chart of 2011 very closely all year, and since stocks rallied during the second half of December 2011, they could do the same in December 2015.
Small-cap stocks have underperformed large-cap stocks year-to-date by -6.1% to -0.8%, but that may be about to change. In November, small caps came to life, beating large caps 3.1% to 0.1%, but so far in December through Tuesday the 15th small caps have reverted back to underperformance, -5.6% to the S&P 500’s -1.8% loss. The second half of December should see small caps shine, however, if history is any guide.
Since the inception of the Russell 2000 index (RUT) in 1984, the small-cap index has risen in December on average by 3.51% with an 89.3% win rate. Even better, RUT has outperformed the S&P 500 in December by 1.83% on average. Furthermore, according to Joe Mezrich of Nomura Securities, small-caps have historically outperformed during periods when the following three market characteristics exist: (1) small-cap price-to-sales ratios are below average relative to large caps; (2) economic uncertainty, as measured by dispersion of earnings estimates, is low; and (3) expectations of future economic growth, as measured by the yield curve, are high. All three market conditions were satisfied as of November.
Perhaps the most amazing statistic is offered up by investment manager Dana Lyons of Chicago-based J. Lyons Fund Management, who discovered that the Russell 2000 index has generated a positive return during December in 21 of 24 years since 1991, and only one of the three negative years (2002) lost more than 0.6%. Even more amazing, except for 2002, on any of the other 124 days during Decembers 1991-2014 that the Russell 2000 closed down more than 0.2% from November’s monthly close, the index has ALWAYS closed the month of December higher than that day’s close. In other words, this means that the Russell 2000 should close out 2015 above 1,191.68 because this is the level the index closed at on December 2nd, which constituted a -0.54% decline from the 1,198.11 close on November 30th. Based on the Russell 2000 index’s close on Tuesday December 15th of 1,131.55, this prediction based on historical precedent would require the index to gain 5.31% from now until the end of the year.
A 5.31% gain would be quite a strong rally for the second-half of December and one worth investing in right now.
Longer term, the stock market is still experiencing the afterglow of very-rare and very-bullish reversals in Coppock Curve, MACD, and Rate of Change (ROC) technical indicators in late November. In past instances since 1983 during bull markets, the stock market subsequently gained double digits percentages each time. For those wondering if we are still in a bull market, the fact that the Nasdaq 100 hit an all-time intraday high on December 2nd (combined with the S&P 500’s new all-time high in cumulative advances/declines on December 1st) should answer the question.
Correlation Analysis
Please note: The goal of the Momentum Portfolio is that all short-term stock holdings move in the same positive direction at the same time. Consequently, I only provide correlation data for the Value Portfolio (long-term focus).
The Value Portfolio Front Runner this month – Equity Commonwealth (EQC) — provides low correlation with the other existing holdings. Using a stock correlation calculator, I created a correlation matrix for the Roadrunner Value Portfolio, including this month’s recommendation of Equity Commonwealth (EQC).
Value Portfolio 3-Year Correlations
EQC | |
AFOP | 0.272 |
DHIL | 0.327 |
DSW | 0.181 |
ECOL | 0.247 |
EXAC | 0.113 |
GIFI | 0.010 |
GNTX | 0.462 |
LSCC | 0.188 |
MSM | 0.185 |
NMIH | 0.168 |
RAX | 0.405 |
RES | 0.133 |
SCL | 0.092 |
SJW | 0.362 |
UTMD | 0.107 |
VPG | -0.027 |
WEYS | 0.405 |
WMK | 0.101 |
WRB | 0.324 |
As you can see above, Equity Commonwealth provides decent diversification benefits to the Value Portfolio. Based on my portfolio analysis software, after deleting poultry producer Sanderson Farms, the Value Portfolio was zero-weight the “real estate” industry sector (benchmark has 5% allocation) and equal-weight the “hard asset” stock type. Equity Commonwealth is both real estate and hard asset, so adding this stock helps diversify the portfolio in one important way (industry sector).
Value Portfolio Composition After Sanderson Farms is Sold
But Before Equity Commonwealth is Added
Industry Sector | Roadrunner Value Portfolio | Mid/Small Cap Benchmark | |
Cyclical | 36.85 | 40.89 | |
Basic Materials | 5.26 | 5.19 | |
Consumer Cyclical | 15.77 | 15.65 | |
Financial Services | 15.81 | 15.07 | |
Real Estate | 0 | 4.98 | |
Sensitive | 42.09 | 40.31 | |
Communication Services | 0 | 1.30 | |
Energy | 10.51 | 5.40 | |
Industrials | 10.56 | 17.29 | |
Technology | 21.02 | 16.33 | |
Defensive | 21.06 | 18.77 | |
Consumer Defensive | 5.27 | 4.63 | |
Healthcare | 10.53 | 11.43 | |
Utilities | 5.26 | 2.71 |
Stock Type | Roadrunner Value Portfolio | Mid/Small Cap Benchmark | |
High Yield | 0.00 | 0.98 | |
Distressed | 0.00 | 2.57 | |
Hard Asset | 10.51 | 9.04 | |
Cyclical | 42.13 | 51.73 | |
Slow Growth | 10.53 | 10.22 | |
Classic Growth | 10.53 | 5.57 | |
Aggressive Growth | 21.04 | 9.43 | |
Speculative Growth | 5.26 | 5.87 | |
Not Classified | 0.00 | 4.60 |
Source: Morningstar
Equity Commonwealth has a very low correlation with technical instrument manufacturer Vishay Precision Group (VPG) and Gulf Island Fabrication (GIFI) because REITs, especially well-managed liquidating REITs, perform well in any economic climate, whereas cyclical technical instruments and oil drilling equipment only outperform in strong economies.
Looking at the correlation matrix below, the best diversifiers are those with a lot of red shadings. If you don’t already own electronic equipment manufacturer Stepan Co., energy services firm Gulf Island Fabrication (GIFI), or medical device manufacturer Exactech (EXAC) in the Value Portfolio, now would be a good time to pick up some shares as all three are currently trading at a buyable price level.
A total correlation matrix is shown below:
Value Portfolio

Stock Talk
Add New Comments
You must be logged in to post to Stock Talk OR create an account