2016 is a High-Risk Year
Market Outlook
The small-cap Russell 2000 index has already experienced a bear market, dropping 26% from its June 23, 2015 high of 1,296 to 956 as of February 8th. The last two times small caps entered a bear market, the final decline percentage was 30% in 2011 and 60% in 2009, so we may be near the end of the bear if the appropriate precedent is the 2011 cyclical downturn rather than the once-in-a-lifetime 2008 global financial crisis. I’m betting that 2016 is not another 2008 simply because the U.S. economy is doing relatively well now, whereas it collapsed in 2008. Some commentators are more worried, however, including George Soros.
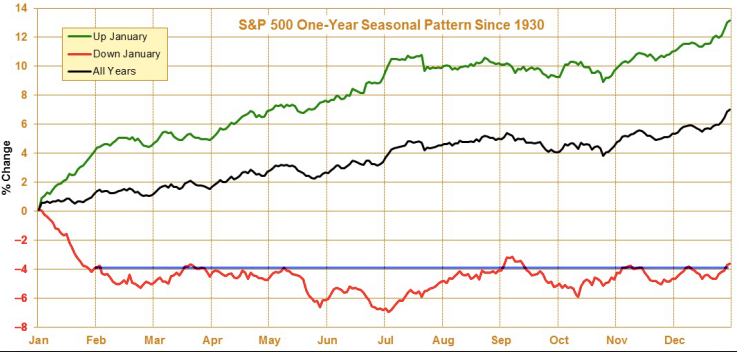
The first Federal Reserve rate hike in more than nine years on December 16th, a weakening Chinese economy and currency, plunging crude oil prices on January 20th to 13-year lows below $27, and geo-political tensions in both the Korean peninsula and in the Middle East between Saudi Arabia and Iran have all combined in a toxic brew to cause the U.S. stock market to start 2016 on a bearish trajectory. In fact, the first two weeks of January saw stocks experience their worst decline during that calendar time period in history. There’s an old Wall Street saying that “as goes January, goes the rest of the year.” January 2016 ended down 5.1%, so that’s a real negative for the future. Although the validity for this “January Barometer” (JB) is suspect, there is some historical support for it in that when January is up, the year is up 80% of the time with an average return of 13.0%. When January is down, the year is up only 44% of the time with an average decline of 1.9%. In years when stocks fall in January, the market trough doesn’t occur until July and then stocks meander in a relatively flat line for the remainder of the year.
The first-five days (FFD) January barometer is a mini-version of the full-month January barometer and it was down a big -6.0% this year. In the last 16 presidential election years (2016 is such a year), full-year stock performance in 14 of the calendar years followed the direction of the FFD. In the 15 years where the S&P 500 suffered its worst FFD declines (2016 being the worst of all), the index generated a positive return in the remaining days of the full calendar year only 43% of the time, with a median rate of return of -2.50%. Not encouraging.
Technically, the S&P 500 closed the month of December below its 10-month simple moving average, which is another red flag. Caution is advised whenever this occurs because all bear markets cannot start until this moving-average level has been breached to the downside. Furthermore, the 10-month weighted moving average has crossed below the 20-month weighted moving average, which is the first occurrence since 2008 – the year the market dropped 38%. Simply put, the charts for stock indices currently look terrible and very bearish and something definitely feels wrong about the stock market’s price action.
Market internals have been deteriorating. During 2015, the percentage of stocks falling into their own individual bear markets of 20% or more increased significantly, with the number of large caps dropping 20% or more from their highs increasing from 8.87% to 19.81%, mid caps from 18.06% to 34.36% and small caps from 39.05% to 61.71%. Things have gotten materially worse in the first week of January 2016, with nearly half of all stocks in the S&P 500 now in individual bear markets. Technical research firm Lowry’s concludes:
While the major price indexes showed little change in 2015, the forces of Supply and Demand are suggesting deteriorating conditions that, over our 88 year history, have been associated with the formation of major market tops.
The curious part of the bearish market behavior is that the U.S. economy continues to hum along healthily, with very-strong December and full-year 2015 job growth and real personal consumption expenditures continuing to rise. In fact, auto sales hit a record high in December 2015 and full-year 2015. The January jobs report on February 5th wasn’t uniformly great, but it was strong enough (151,000 new jobs, rising wages, and unemployment rate down to eight-year low of 4.9%) that it caused the Atlanta Federal Reserve Bank’s GDPNow forecast for the first quarter to almost double — from 1.2% annualized growth on February 1st to 2.2% annualized growth on February 5th. Employees are quitting their jobs at an increasing rate, which only happens if the job market is strong and they have better jobs to choose from.
Prolonged and severe bear markets occur during economic recessions and the U.S. is not in anywhere near a recession. According to economist Dwayne Van Vuuren:
Despite many pockets of disconcerting co-incident indicator weakness, many brought on by the energy and commodities complex, the risk of near-term recession appears low. Although many short-leading indicators are showing recession there are not enough of them yet to warrant a confident recession call. What remains highly elusive is finding long-leading data that points to recession.
On the other hand, the bond market is flashing some warning signals. The yield curve has been flattening, with the difference between the two-year U.S. Treasury note and the 30-year U.S. Treasury bond falling to only 107 basis points, which is the smallest difference since January 2008. Recessions often occur when the yield curve inverts (i.e., yield on short-term notes is higher yield than on long-term bonds), which is not the case now (yet) but the trend is in the wrong direction. According to the New York Federal Reserve Bank, the current yield curve predicts only a 4.56% chance of a recession.
Corporate insiders don’t seem worried; they continue to snap up shares in their companies despite the fact that in the fourth quarter of 2015 corporate profits declined year-over-year for the third consecutive quarter. S&P 500 earnings per share dropped 7% for the full year of 2015, the largest drop ever in a non-recessionary period thanks to the double-whammy effect of the collapse in oil prices and the strength in the U.S. dollar. The “main street” economy is doing well, while Wall Street is in a profits recession.
Bear markets can occur outside of economic recessions, but they are typically shorter and less severe. LPL Financial puts the odds of a non-recessionary bear market for the S&P 500 in 2016 at no more than 30%. If one were to occur, it would probably look like the non-recessionary bear market of 1976-78, which saw the S&P 500 fall only 19% and take 18 months to finalize (368 trading days). The current price decline now has only taken 179 days, which means that the current market pain may last upwards of another nine months but probably won’t drop more than an additional 7-8%.
If oil prices and the U.S. dollar can stabilize here, corporate earnings in 2016 could easily grow 8-10% in 2016, resulting in a similar 8-10% rise in the stock indices. The S&P 500 could do even better in 2016 after 2015’s flat return of -0.73% (not including dividends) because since 1960, whenever the price-only index has ended the year flat (i.e., between -3.0% and +3.0%), the following calendar year has seen stocks finish up every time and by an average gain of 19%. Investor sentiment has reached “panic” levels according to Citigroup’s Panic/Euphoria Model, which historically has signaled very-positive returns over the following 12 months. Sentiment is so low that a short-term rally is imminent, even if we are entering a bear market.
The key is China and whether its economic slowdown will snowball into something worse and drag the rest of the global economy down with it. China’s debt-to-GDP ratio has increased to 240% from 160% since 2007 (50% more) and the country’s economy appears to be choking on the combination of an aging population and the increased debt load. The Communist government’s command economy has wasted resources on ghost cities and other gigantic and unnecessary public infrastructure projects that don’t provide a return on investment. A recessionary China would not only cause commodity prices to drop even further and hurt global commodity producers, as well as U.S. machinery and technology exports to the country, but it would likely cause a significant devaluation of the Chinese yuan currency, which would force other emerging-market countries (e.g., South Korea, Indonesia, Malaysia and Taiwan) to devalue their currencies and make it much more difficult for many of these countries to repay back their U.S. dollar-denominated debt, resulting in a full-blown global financial crisis.
Former U.S. Treasury Secretary and Harvard economist Larry Summers is worried that China in 2016 could turn out to be the third bursting financial bubble of the 21st Century (Nasdaq in 2000 and housing in 2008 being the other two):
While it certainly could be the case that the Chinese developments reflect a combination of market psychology and clumsy policy responses, and that the strong response of world markets is an example of transient contagion, I doubt it.
Traditionally, international developments have had only a limited impact on the U.S. and European economies because their impact could be offset by monetary policy actions. Thus, the U.S. economy grew robustly through the 1997-98 Asian financial crisis as the Fed brought interest rates down. With rates essentially at zero in the industrial countries, however, this option is no longer available, and foreign economic problems are likely to have much more direct effects on economic performance.
Because of China’s scale, its potential volatility and the limited room for conventional monetary maneuvers, the global risk to domestic economic performance in the United States, Europe and many emerging markets is as great as anytime I can remember. It is time for policymakers to hope for the best and plan for the worst.
Global exports contracted in 2015 by the second-largest percentage since 1958 (second only to 2009).Bond king Jeffrey Gundlach takes his cue from market prices that things are not well in the global economy — collapsing commodity prices and transportation stocks at 52-week lows despite the profit-margin boost from low fuel prices leads him to predict a 30% probability of a U.S. recession starting in 2016.
Granted, markets can anticipate economic slowdowns before they show up in the macro data, but it is also true that market swoons have generated several false positives, predicting “nine of the last four recessions” as MIT economist Paul Samuelson used to say. But I believe the Fed will not want to take chances on a false positive from the recent market turmoil and therefore adjust its thinking on rate hikes down from its previous plan to raise interest rates four times in 2016 (once per quarter) to only one or two times. I’ll be rooting for at least two rate hikes because less than two hikes would mean the economy is falling into recession and then a bear market in stocks is almost guaranteed. Historically, based on the past nine Fed rate-hike cycles, the S&P 500 has always peaked after the first rate hike and before the next recession. If history were to play out this time around, that would mean the S&P will reach a new high above the May 2015 high of 2,134.72 before a recession hits and takes the stock market down big time.
Lastly, uncertainty over the U.S. presidential election is another wildcard that may inhibit stock returns, especially in year where a new person must be elected because of term limits. Since 1928, election years where a new president must be elected have averaged a 4% loss, compared to an average 7% gain in election years where an incumbent president is running again.
Bottom line: Uncertainty concerning China and global economic growth, combined with poor stock-market technicals, make 2016 a high-risk year, so I am more prone to sell rallies than buy dips until there is some semblance of stabilization. After a short-term rally that should start soon, we are prone to see more downside market action in the immediate months ahead, but a severe bear market typically does not occur outside of a recession and the odds still favor no recession in 2016.
Correlation Analysis
The Value Portfolio Front Runner this month – National Presto Industries (NPK) — provides low correlation with the other existing holdings. Using a stock correlation calculator, I created a correlation matrix for the Roadrunner Value Portfolio, including this month’s recommendation of National Presto Industries (NPK).
Value Portfolio 3-Year Correlations
NPK | |
AFOP | 0.361 |
DHIL | 0.194 |
DSW | 0.306 |
ECOL | 0.513 |
EQC | 0.472 |
EXAC | 0.278 |
GIFI | 0.292 |
GNTX | 0.612 |
LSCC | 0.311 |
MSM | 0.248 |
NMIH | 0.293 |
RAX | 0.247 |
SCL | 0.533 |
SJW | 0.338 |
UTMD | -0.041 |
VPG | 0.517 |
WEYS | 0.433 |
WMK | 0.601 |
WRB | 0.524 |
As you can see above, National Presto Industries provides decent diversification benefits to the Value Portfolio. Based on my portfolio analysis software, after deleting energy services firm RPC Inc., the Value Portfolio was underweight both the “industrial” industry sector (10.5% vs. 17.3% for benchmark) and the “cyclical” stock type (42.1% vs. 51.7% for benchmark). National Presto Industries is both industrial and cyclical, so adding this stock helps diversify the portfolio in two important ways (industry sector and stock type).
Value Portfolio Composition After RPC Inc. is Sold
But Before National Presto Industries is Added
Industry Sector | Roadrunner Value Portfolio | Mid/Small Cap Benchmark | |
Cyclical | 42.14 | 40.89 | |
Basic Materials | 5.26 | 5.19 | |
Consumer Cyclical | 15.78 | 15.65 | |
Financial Services | 15.85 | 15.07 | |
Real Estate | 5.26 | 4.98 | |
Sensitive | 36.80 | 40.31 | |
Communication Services | 0 | 1.30 | |
Energy | 5.26 | 5.40 | |
Industrials | 10.53 | 17.29 | |
Technology | 21.02 | 16.33 | |
Defensive | 21.05 | 18.77 | |
Consumer Defensive | 5.27 | 4.63 | |
Healthcare | 10.52 | 11.43 | |
Utilities | 5.26 | 2.71 |
Stock Type | Roadrunner Value Portfolio | Mid/Small Cap Benchmark | |
High Yield | 0.00 | 0.98 | |
Distressed | 0.00 | 2.57 | |
Hard Asset | 10.52 | 9.04 | |
Cyclical | 42.12 | 51.73 | |
Slow Growth | 10.52 | 10.22 | |
Classic Growth | 10.52 | 5.57 | |
Aggressive Growth | 21.06 | 9.43 | |
Speculative Growth | 5.25 | 5.87 | |
Not Classified | 0.00 | 4.60 |
Source: Morningstar
National Presto Industries has a very low correlation with feminine healthcare supplier Utah Medical Products (UTMD) and Diamond Hill Investment Group (DHIL) because congolmerates are industrial cyclicals that outperform in strong economies with rising interest rates, whereas healthcare and asset management outperform in moderate economies with low interest rates.
Looking at the correlation matrix below, the best diversifiers are those with a lot of red shadings. If you don’t already own feminine healthcare supplier Utah Medical Products (UTMD) or industrial products distributor MSC Industrial Supply (MSM) in the Value Portfolio, now would be a good time to pick up some shares as both are currently trading at a buyable price level.
A total correlation matrix is shown below:
Value Portfolio

Stock Talk
Add New Comments
You must be logged in to post to Stock Talk OR create an account