Warning Signs
Market Outlook
The S&P 500 suffered a minor 2.3-percent correction in the second week of March in reaction to Russia’s invasion of Crimea, but after investors determined that Obama would not escalate the crisis, the correction ended and the rally resumed with the S&P 500 hitting a new intraday high on March 21st. According to market technician Jason Goepfert:
Quick price shocks to a momentum market rarely lead to sustained selling pressure, at least over the next few months.
Liz Ann Sonders of Schwab and Ed Yardeni of Yardeni Research both argue that the current stock market could keep going higher in a late 1990s-style melt-up.
The U.S. economy appears to be gaining momentum. Consumer confidence is at a six-year high, durable goods orders are rising, and fourth-quarter GDP growth was revised upward, suggesting that:
the economy had momentum as 2013 ended and should regain strength once the effects of unseasonably cold weather that dampened activity at the beginning of this year start to abate.
Combined with no inflation and low interest rates that may remain low, conditions simply do not exist for the beginning of a bear market. The S&P 500 remains comfortably above its uptrending 10-month moving average, so the Ivy Portfolio market-timing system continues to flash a “fully invested” signal. In fact, looking at the monthly chart, it appears that the S&P 500 has broken out to the upside in March out of a three-month consolidation between December and February.
Fed Chairman Janet Yellen, in her first policy statement (March 19th) since taking over from Ben Bernanke, continued to taper quantitative easing (QE), reducing the monthly bond purchases to $55 billion from the previous $65 billion. The taper continued despite the policy statement conceding that an economic slowdown had occurred during the winter months. In addition, Yellen made several changes to the language that collectively raised concern that short-term rates would start rising earlier than previously expected:
- Eliminates the “6.5% or below” unemployment rate threshold for raising short-term interest rates, replacing it with a much vaguer “progress toward its objectives of maximum employment.”
- Eliminates “half a percentage point above” the 2% inflation target, replacing it with the 2% inflation target, which suggests less tolerance of inflation.
- Changes the time frame for raising short-term interest rates from “well past time” the unemployment rate falls to 6.5% to “a considerable time” after QE asset purchases end — a completely different benchmark.
In the press conference, Yellen clarified that the phrase “a considerable time” meant “around six months.” Since QE bond buying is expected to end by the beginning of 2015, this clarification suggests that short-term rates will start rising around June 2015, which is earlier than many analysts had expected. The stock market briefly sold off for two days after the policy statement was released, but then rebounded when Fed officials stated that Yellen had not meant to change interest-rate policy and that her “six months” comment was dependent on economic conditions improving. Chicago Fed bank president Charles Evans predicted that the first rate hike would occur in the second half of 2015, but stated his preference that the first rate hike not occur until early 2016.
Foreign stocks continue to perform well. In Europe, the European Central Bank is rumored to be planning a “QE blitz” of extraordinary monetary stimulus. Greek government bond prices have nearly quintupled since their 2012 lows. Asian stocks are rising on hopes of Chinese fiscal and monetary stimulus. Furthermore, emerging-market stocks have enjoyed their strongest rally since last October.
Warning Signs
Value-investing legend Seth Klarman wrote in his 2013 shareholder letter that the stock market is being manipulated by global central banks and does not reflect economic reality — similar to “The Truman Show.” Current-day euphoria where “stocks have risen in price beyond all reason” will end badly at some unknown point of time in the future and when it does: “Few will be ready. Few will be prepared.” In March 2014, the ratio of total U.S. stock-market capitalization to U.S. GDP has exceeded 110 percent, which is the highest level of the past 40 years (except for the Internet bubble market of 2000), higher even than the 2007 market peak that led to the 2008 market collapse.
High-flying momentum stocks in the Internet (e.g., GOOG, FB, PCLN, NFLX) and biotechnology (e.g., ALXN, REGN, CELG, GILD) sectors have already begun to crack with steep corrections. The question is whether the general market indices can remain stable despite the collapse in momentum names. According to Jeff Macke of Yahoo! Finance, “markets seldom limit corrections to specific sectors.” Evidence in favor of the tech weakness spreading to the overall market is the Nasdaq/NYSE Relative Strength Index, which was created by market technician Gerald Appel. Whenever the Nasdaq is outperforming the NYSE, both stock indices perform better. In contrast, when the NYSE outperforms the Nasdaq, both indices perform worse and tend to produce, on average, only breakeven investment returns. In the last week of March, both the Nasdaq and the Russell 2000 suffered their worst weekly declines since 2012 (while both the S&P 500 and Dow Jones Industrials barely budged). As a result, the Nasdaq/NSYE relative strength dropped decisively below its 10-week moving average for the first time since late September 2012.
According to University of Michigan finance professor Nejat Seyhun: insider selling is “as pessimistic as I’ve ever seen over the last 25 years.” More pessimistic than in 2007 (before 37% bear market in 2008) and more pessimistic than in 2011 (before 20% market correction). The Citibank Panic/Euphoria model is reaching a new 14-year high of investor euphoria which is correlated with negative future 12-month stock returns. The Investor Intelligence bull/bear ratio has been above 3 for most of the past five months, which is longer than any time since the 1980s. The instances in the ’80s of similarly-extreme bullish sentiment among newsletter editors resulted in stagnant or down markets for the following 6-18 months.
According to Bloomberg, small-cap stocks have risen for seven consecutive quarters, the longest period ever. The P/E ratio of the small-cap Russell 2000 index is now 49, which is 26% above the 39 P/E ratio at the Internet-bubble market top in March 2000. To be fair, the Internet bubble was concentrated in large-cap stocks and small caps were no where near as overvalued in 2000, so exceeding the 2000 peak doesn’t indicate to me that small caps are primed to fall. Furthermore, the Russell 2000 index’s current 49 P/E ratio is skewed by a few high-fliers — nine stocks have P/E ratios over 1,000! Needless to say, Roadrunner Stocks focuses on value and avoids such expensive small caps.
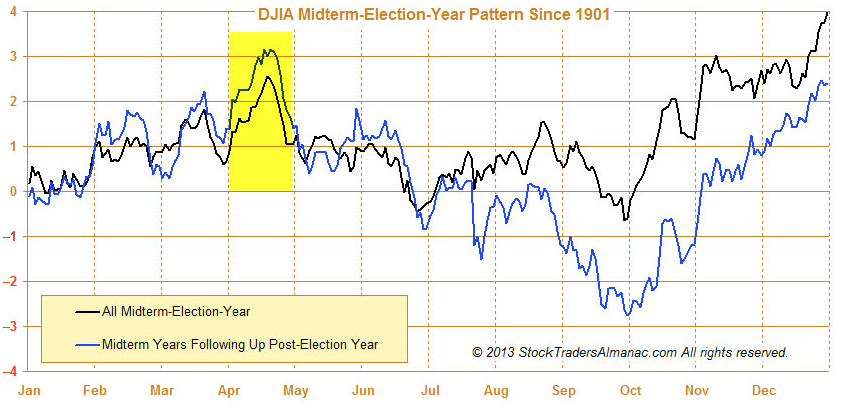
Short term, the market is primed to advance based on positive seasonality during the first half of April. According to ukarlewitz, only two trading days during the first three weeks of April have historically risen less than 50% of the time. In fact, Aprils in mid-term election years are historically extra-bullish. However, between mid-July and the end of September, mid-term election years are extra-bearish.
Roadrunner Stocks Relative Performance
Since the Roadrunner service launched on January 24, 2013, the small-cap Russell 2000 has outperformed large caps. Through February 2014, the Russell 2000 had outperformed the large-cap S&P 500 in 12 out of 13 time periods between the release of a Roadrunner monthly issue and the release of the latest monthly issue. But March 2014 changed all that thanks to the S&P 500 significantly outperforming the Russell 2000. A return difference of 1.58% may not seem like much, but when the margin of outperformance over several periods is small, such a one-month reversal of fortune can have a domino effect on several prior time periods. In fact, SPY’s outperformance in the single month of March 2014 caused the prior four periods (starting Nov. 4th, Dec. 2nd, Jan. 6th, and Jan. 30th ) to switch from small-cap outperformance to large-cap outperformance. So, the tally of relative performance is now considerably narrowed, with small caps superior in only 8 out of the 14 total periods. Small-cap outperformance has still occurred a majority of the time, to be sure, but just barely. All six of the time periods where large caps have won the race have been the most recent. In other words, small caps have not outperformed large caps since the September 3rd Roadrunner issue!
My guess is that small caps were disproportionately hurt by the October shutdown of the federal government, which caused fourth-quarter GDP to decelerate, as well as geopolitical fears surrounding Russia’s invasion of Ukraine, which caused a flight to the less-volatile safety of large caps. During a bull market when the volatility index (VIX) is below 20 (like now), it’s very rare for small caps to underperform large caps by a full percentage point or more over 5, 10, 20, and 50-day periods. Since 2006, it has only occurred 14 times and usually doesn’t last long. I’m confident that small caps can start outperforming again in the near future thanks to expectations of strengthening economic growth and a calmer geopolitical backdrop. The tailwinds for small caps outlined in my January 2013 article Small Caps: The Time to Invest is Now remain firmly in place.
Total Return Thru March 31st
Start Date | S&P 500 ETF (SPY) | Russell 2000 ETF (IWM) | Advantage |
January 24th , 2013 | 28.26% | 32.42% | Small cap |
February 27th | 26.15% | 30.93% | Small cap |
March 28th | 21.77% | 24.87 % | Small cap |
April 26th | 20.56% | 26.92% | Small cap |
May 24th | 15.41% | 20.46% | Small cap |
June 28th | 18.30% | 21.56% | Small cap |
July 29th | 12.57% | 13.55% | Small cap |
September 3rd | 15.44% | 16.16% | Small cap |
October 1st | 11.52% | 8.56% | Large cap |
November 4th | 6.80% | 6.47% | Large cap |
December 2nd | 4.61% | 4.20% | Large cap |
January 6th , 2014 | 3.00% | 2.53% | Large cap |
January 30th , 2014 | 4.80% | 3.22% | Large cap |
March 4th , 2014 | 0.14% | -2.66% | Large cap |
Source: Bloomberg
Almost half (17 out of 36) of Roadrunner recommendations have outperformed the S&P 500 and both the Value and Momentum portfolios have a positive average return. The Value Portfolio continues to be the real star, with 11 out of 18 holdings (61.1%) outperforming and sporting an average return of 35.5% , 18.7 percentage points better than the S&P 500. In contrast, the March mini-correction really socked it to the Momentum Portfolio, which was still reeling from the earlier January/February market correction, and now only six of its 18 holdings (33.3%) have outperformed the S&P 500. The average return of the Momentum Portfolio is 7.4%, which — while positive — trails the S&P 500 by 9.4 percentage points. Once the Momentum Portfolio reaches its maximum 20 names, I plan to sell stocks much more frequently so that only those that continue to exhibit positive momentum remain. I’m confident that more frequent trading of momentum names will allow the portfolio to outperform as intended.
Overall, 27 of 36 Roadrunner holdings (75.0%) have generated positive absolute returns. Below, each Roadrunner portfolio lists the best relative performers in descending order:
Value Portfolio
(thru March 31st)
Roadrunner Stock | Start Date | Roadrunner Performance | S&P 500 ETF (SPY) | Roadrunner Outperformance? |
Diamond Hill Investment Group (DHIL) | 1-24-13 | 93.93% | 28.26% | +65.67% |
Brocade Communications (BRCD) | 2-27-13 | 88.79% | 26.15% | +62.64% |
FutureFuel (FF) | 3-28-13 | 74.40% | 21.77% | +52.63% |
United Therapeutics (UTHR) | 1-24-13 | 76.85% | 28.26% | +48.59% |
Carbo Ceramics (CRR) | 1-24-13 | 74.94% | 28.26% | +46.68% |
Gentex (GNTX) | 1-24-13 | 68.82% | 28.26% | +40.56% |
GrafTech International (GTI) | 4-26-13 | 54.67% | 20.56% | +34.11% |
Lydall (LDL) | 12-2-13 | 32.27% | 4.61% | +27.66% |
U.S. Ecology (ECOL) | 9-3-13 | 32.39% | 15.44% | +16.95% |
Fabrinet (FN) | 1-6-14 | 9.32% | 3.00% | +6.32% |
W.R. Berkley (WRB) | 3-04-14 | 1.64% | 0.14% | +1.50% |
Stepan Co. (SCL) | 6-28-13 | 17.07% | 18.30% | -1.23% |
Stewart Information Services (STC) | 10-1-13 | 9.45% | 11.52% | -2.07% |
Weyco Group (WEYS) | 1-30-14 | -0.64% | 4.80% | -5.44% |
ManTech International (MANT) | 7-29-13 | 4.10% | 12.57% | -8.47% |
Exactech (EXAC) | 11-4-13 | -2.89% | 6.80% | -9.69% |
Fresh Del Monte Produce (FDP) | 5-24-13 | 0.82% | 15.41% | -14.59% |
Buckle (BKE) | 1-24-13 | 3.43% | 28.26% | -24.83% |
AVERAGES |
| 35.52% | 16.80% | 18.72% |
Momentum Portfolio
(thru March 31st)
Roadrunner Stock | Start Date | Roadrunner Performance | S&P 500 ETF (SPY) | Roadrunner Outperformance? |
G-III Apparel (GIII) | 5-24-13 | 72.07% | 15.41% | +56.66% |
U.S. Physical Therapy (USPH) | 4-26-13 | 46.71% | 20.56% | +26.15% |
CBOE Holdings (CBOE) | 1-6-14 | 11.51% | 3.00% | +8.51% |
Western Refining (WNR) | 1-24-13 | 33.63% | 28.26% | +5.37% |
PriceSmart (PSMT) | 1-24-13 | 30.67% | 28.26% | +2.41% |
HomeAway (AWAY) | 2-27-13 | 27.96% | 26.15% | +1.81% |
Hill-Rom Holdings (HRC) | 9-3-13 | 14.42% | 15.44% | -1.02% |
Apogee Enterprises (APOG) | 11-4-13 | 4.37% | 6.80% | -2.43% |
Valmont Industries (VMI) | 10-1-13 | 8.66% | 11.52% | -2.86% |
International Speedway (ISCA) | 12-2-13 | -1.68% | 4.61% | -6.29% |
Chase Corp. (CCF) | 1-30-14 | -3.73% | 4.80% | -8.53% |
Darling International (DAR) | 6-28-13 | 7.29% | 18.30% | -11.01% |
WisdomTree Investments (WETF) | 3-04-14 | -16.96% | 0.14% | -17.10% |
Ocwen Financial (OCN) | 1-24-13 | 6.93% | 28.26% | -21.33% |
CommVault Systems (CVLT) | 3-28-13 | -20.79% | 21.77% | -42.56% |
LeapFrog Enterprises (LF) | 7-29-13 | -33.80% | 12.57% | -46.37% |
SolarWinds (SWI) | 1-24-13 | -21.98% | 28.26% | -50.24% |
HMS Holdings (HMSY) | 1-24-13 | -32.90% | 28.26% | -61.16% |
AVERAGES |
| 7.35% | 17.78% | -9.44% |
Correlation Analysis
The Value and Momentum Front Runners this month both provide low correlation with the other existing holdings. Using a stock correlation calculator, I created correlation matrices for both Roadrunner portfolios, including this month’s recommendations. The time frames for the correlations were daily measuring periods over three years:
Momentum Portfolio 3-Year Correlations
WOOF | |
APOG | 0.461 |
AWAY | 0.262 |
CBOE | 0.236 |
CCF | 0.195 |
CVLT | 0.227 |
DAR | 0.374 |
GIII | 0.230 |
HMSY | 0.363 |
HRC | 0.280 |
ISCA | 0.309 |
LF | 0.169 |
OCN | 0.351 |
PSMT | 0.177 |
SWI | 0.430 |
USPH | 0.245 |
VMI | 0.351 |
WETF | 0.289 |
WNR | 0.266 |
Value Portfolio 3-Year Correlations
| WERN |
BRCD | 0.465 |
BKE | 0.371 |
CRR | 0.218 |
DHIL | -0.009 |
ECOL | 0.181 |
EXAC | 0.231 |
FDP | 0.328 |
FF | 0.160 |
FN | 0.158 |
GNTX | 0.429 |
GTI | 0.150 |
LDL | 0.321 |
MANT | 0.299 |
SCL | 0.381 |
STC | 0.265 |
UTHR | 0.350 |
WEYS | 0.062 |
WRB | 0.349 |
As you can see above, both VCA Antech and Werner Enterprises provide good diversification benefits to the Momentum and Value portfolios. Based on my portfolio analysis software, the Momentum Portfolio was slightly underweight the “health care” sector, so an animal hospital and diagnostic center fits the bill. The stock’s “aggressive growth” stock type is already slightly overweight in the Momentum portfolio, so no help there. In contrast, the Value Portfolio was significantly underweight the “industrial” sector and slightly underweight the “cyclical” stock type, so a trucking company provides the perfect complement to the other Value Portfolio holdings for both sector and stock type. Diversification by both industry sector and stock type are important investment considerations.
VCA Antech is most negatively correlated with LeapFrog Enterprises, which is a bit surprising since families with pets are more likely to be families with children. Maybe when the cost of pet care rises, there is less money left over to buy the kids educational games. Werner Enterprises has a negative correlation with Diamond Hill Investment Group because Werner’s trucking business is cyclical and does best when the economy is smoking hot, whereas stock and fixed-income investments tend to perform better when the economy is growing moderately and interest rates are low.
Looking at the correlation matrices below, the best diversifiers are those with a lot of red shadings. If you don’t already own Chase Corp. and/or LeapFrog Enterprises in the Momentum Portfolio, now would be a good time to pick up some shares in them. Buckle and Fabrinet in the Value Portfolio also look like good diversifiers and are trading at a buyable price level.
Total correlation matrices are shown below:
Momentum Portfolio

Value Portfolio

Stock Talk
Add New Comments
You must be logged in to post to Stock Talk OR create an account