Small Caps Rebound
Market Outlook
The S&P 500 closed last week (May 30) above 1,923 at an all-time closing high, the sixth record high in the last seven trading sessions of the month. It’s hard to be bearish with such positive price action. All major U.S. stock indices remain above their 10-month moving averages, as do indices on European stocks, intermediate-term government bonds, REITs, and commodities. According to the Ivy Portfolio market-timing system, all five of these asset classes are currently flashing “fully invested” trading signals.
A disturbing price divergence from the record-setting bullish trends of the S&P 500 and Dow Jones Industrials has occurred, however, in the small-cap Russell 2000 index, which on May 14th fell below its 200-day moving average for the first time in 17 months (since Nov. 2012) and suffered a 10.7-percent intraday correction in the two months following an all-time high on March 4th. Whether this small cap/large cap divergence will result in the S&P 500 following the Russell 2000 down 10 percent or whether the small-cap woes can remain contained is a matter of great debate with no clear winner, but the fact that small caps have rebounded 6% from the low they hit on May is encouraging.
Financial blogger Barry Ritholz says the divergence is a warning sign of increased risk aversion that suggests flat returns for the remainder of 2014 but the bull market deserves the benefit of the doubt and it is premature to panic and cash out of stocks (i.e., “cautious” optimism). As one commentator explains, headwinds exist but market timing often backfires and small caps are destined to perform well if you have a long-term perspective:
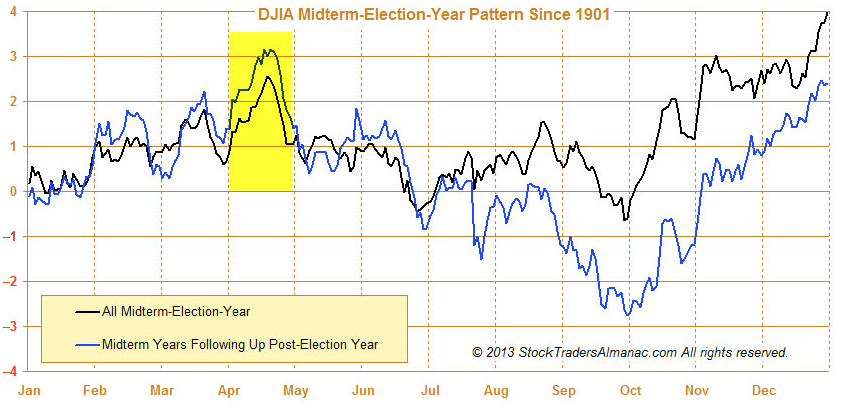
According to historical data from S&P Capital IQ, the two worst quarters in terms of performance for small-cap stocks are the two that immediately precede the mid-term elections during a Presidential cycle. In other words, the current quarter and the next. The average decline during these two periods in the Russell 2000 is 3.5% and 6.6%, respectively.
Based on this historical performance, you may be tempted to sell your small-cap stocks right now and get back in a few quarters. But before you do, know that the data also shows that the Russell 2000 still rose about 25% and 50% of the time during these two periods.
The good news is the S&P Capital IQ data also shows that the strongest quarters for small-cap stocks are the three that follow the third quarter of a mid-term election year with the average gain of 27% in the Russell 2000 during this period.I believe the right move is to hold tight and ride out any additional material weakness that may materialize.
Across the pond in England, small caps have also taken a hit and a fund manager there now believes there is a “huge buying opportunity.” All in all, I am a bit worried that 2014 (a mid-term election year) could experience some nasty negative volatility in the second half of the year. One way to protect yourself is to reduce your position size (i.e., fewer shares) on equity investments. According to ukarlewitz, the market looks technically “healthy” on a daily chart, but high valuations, extremely bullish investor sentiment, and unprecedented bullish price momentum (except for the Internet bubble of the 1990s, the S&P 500 has never stayed above its 200-day moving average as long as it has currently) all spell trouble in the intermediate term — thanks to the concept of reversion to the mean. Low trading volume at new highs could suggest a top is forming.
Even in the short term, seasonality is turning bearish:
Since 1950, DJIA has lost –1.9% and SPX –2.1% on average. The last 20 years have been even weaker. Moreover, SPX has been down in 11 of the last 16 midterm Junes.
The first five trading days of June are historically bullish and then the bears take over for the remainder of the month. A market top in early June would coincide nicely with the next interest-setting policy meeting of the European Central Bank (ECB) on Thursday June 4th. Most economists expect the ECB to cut interest rates and provide some guidance on future monetary easing initiatives. The U.S. dollar has strengthened and U.S. bond yields have collapsed in anticipation of an ECB cut, so any disappointment on the actual news may cause a market disturbance. One commentator goes so far as to say the the ECB meeting on June 4th is “the most important market event of the year.” On Friday, the S&P 500 Volatility Index (VIX) closed for a fifth straight day below 12, the longest stretch since February 2007, so the ECB announcement on Thursday morning could be the perfect excuse to stir things up and increase volatility.
On the economic front, first-quarter 2014 GDP shrank by 1.0%, marking the first economic contraction in three years (since Q1 2011) and a sharp deceleration from the 2.6% growth in the fourth quarter of 2013. The second quarter didn’t start out any better, with consumer spending dropping in April for the first time in over a year and household income also dropping. The economic contraction in Q1 explains why bond prices have rallied so hard this year, as well as why small caps have underperformed — but Citigroup says that the bond rally is “technical” short covering and not real buying based on recession fears. Art Cashin of UBS characterizes the bond rally as a “curiosity” that is based less on fears of U.S. economic weakness and more on the relative attractiveness of U.S. fixed income compared to incessant interest-rate reductions in Europe and Japan. Similarly, Byron Wien of Blackstone attributes the bond rally to anything but fears of weak economic growth in the U.S.:
Why are rates so low? Part of the answer may be the need for institutional investors to rebalance their portfolios since equities have done so much better than bonds over the past two years. Another reason is the abundant liquidity that has built up around the world as a result of improved corporate profitability in the economic recovery. A third reason could be some apprehension over geopolitical instability around the world and the desire to “park” funds in safe instruments until there is more clarity on the outlook.
Lower interest rates (regardless of their cause) are making the stock market cheaper on a valuation basis and investor fears based on a historically-high 10-year cyclically adjusted P/E (CAPE) are misplaced. In fact, whenever interest rates are this low, the stock market has a 91% probability of rising over the following 12 months. But just because bonds may be overvalued doesn’t mean that stocks can’t be overvalued also. In fact, the chief investment officer of private equity firm Apollo Global Management thinks “every asset class is overvalued.”
On the positive side, Wharton finance professor Jeremy Siegel says the stock market is still cheap on a trailing-12-month P/E ratio basis and Byron Wien is confident that the U.S. economy is on the verge of a growth rebound. Stronger economic growth would be a BIG positive for small-cap stocks. For example:
- April new home sales rose the most in six months
- May manufacturing production growth month-over-month hit a three-year high
- Business activity in the Chicago region expanded in May for a thirteenth straight month to the highest level since last October.
- More companies raised earnings guidance than lowered guidance for the first time in 2½ years
- The Citigroup Economic Surprise Index turned positive
Despite the likelihood of a U.S. economic rebound in the second quarter, even hedge-fund bull David Tepper is getting nervous with Fed QE tapering, stretched valuations, and seasonality. Nevertheless, LPL Financial chief market strategist Jeff Kleintop notes that every recession and bear market of the past half century has been preceded by an inverted yield curve (i.e., 3-month Treasury yield higher than 10-year Treasury yield) and the current yield curve remains very steep and bullish with the 10-year yield 2.5 percent higher than the 3-month yield. The spread between junk-bond yields and investment-grade yields also typically widens in anticipation of a bear market and that is not the case now, with the junk-bond spread very narrow.
In conclusion, I remain bullish on small-cap stocks because the prime determinant of small-cap outperformance is strong economic growth and pretty much all of the economist I respect believe first-quarter weakness was temporarily caused by bad winter weather and are forecasting growth to pick up in future quarters.
Roadrunner Stocks Relative Performance
Small-cap stocks continued to underperform large caps in May 2014, but the good news is that the small-cap Russell 2000 gained 2.53%, which is the best performance since last November and suggests that a turnaround is in progress. Based on the concept of reversion to the mean, small caps are likely set to begin a long string of outperformance since through May 2014, the Russell 2000 has underperformed the S&P 500 in all 16 Roadrunner time periods.
Total Return Thru May 30th
Start Date | S&P 500 ETF (SPY) | Russell 2000 ETF (IWM) | Advantage |
January 24th , 2013 | 32.15% | 28.46% | Large cap |
February 27th | 29.97% | 27.01% | Large cap |
March 28th | 25.46% | 21.13 % | Large cap |
April 26th | 24.22% | 23.13% | Large cap |
May 24th | 18.91% | 16.86% | Large cap |
June 28th | 21.89% | 17.92% | Large cap |
July 29th | 15.98% | 10.15% | Large cap |
September 3rd | 18.94% | 12.69% | Large cap |
October 1st | 14.90% | 5.31% | Large cap |
November 4th | 10.04% | 3.28% | Large cap |
December 2nd | 7.78% | 1.08% | Large cap |
January 6th , 2014 | 6.13% | -0.53% | Large cap |
January 30th , 2014 | 7.98% | 0.13% | Large cap |
March 4th , 2014 | 3.17% | -5.57% | Large cap |
April 3rd, 2014 | 2.15% | -3.70% | Large cap |
May 6th, 2014 | 3.16% | 2.53% | Large cap |
Source: Bloomberg
A majority (21 out of 40) of Roadrunner recommendations have outperformed the Russell 2000 small-cap index and both the Value and Momentum portfolios have a positive average return. The Value Portfolio continues to be the real star, with 13 out of 20 holdings (65.0%) outperforming the Russell 2000 and sporting an average return since inception of 30.37%, 16.68 percentage points better than the Russell 2000. In contrast, the Momentum Portfolio – which is in the process of being reformulated – has only eight of its 20 holdings (40.0%) outperforming the Russell 2000, but this is a significant improvement from last month. One reason for the improved performance of the Momentum Portfolio is that my new stock-selection criteria has already proven itself, with Vipshop Holdings (VIPS) outperforming its Russell benchmark by a whopping 7.73% in its first month as a portfolio holding!
Performance Scorecard
Overall, 27 of 40 Roadrunner holdings (67.5%) have generated positive absolute returns. Below, each Roadrunner portfolio lists the best relative performers in descending order:
Value Portfolio
(thru May 30th)
Roadrunner Stock | Start Date | Roadrunner Performance | Russell 2000 ETF (IWM) | Roadrunner Outperformance? |
U.S. Ecology (ECOL) | 9-3-13 | 76.91% | 12.69% | +64.22% |
Lydall (LDL) | 12-2-13 | 59.57% | 1.08% | +58.49% |
United Therapeutics (UTHR) | 1-24-13 | 80.06% | 28.46% | +51.60% |
Diamond Hill Investment Group (DHIL) | 1-24-13 | 80.02% | 28.46% | +51.56% |
Carbo Ceramics (CRR) | 1-24-13 | 74.79% | 28.46% | +46.33% |
Brocade Communications (BRCD) | 2-27-13 | 62.28% | 27.01% | +35.27% |
FutureFuel (FF) | 3-28-13 | 48.62% | 21.13% | +27.49% |
Gentex (GNTX) | 1-24-13 | 55.55% | 28.46% | +27.09% |
GrafTech International (GTI) | 4-26-13 | 48.02% | 23.13% | +24.89% |
W.R. Berkley (WRB) | 3-04-14 | 8.84% | -5.57% | +14.41% |
Werner Enterprises (WERN) | 4-03-14 | 2.29% | -3.70% | +5.99% |
Weyco Group (WEYS) | 1-30-14 | 1.19% | 0.13% | +1.06% |
Fabrinet (FN) | 1-6-14 | 0.11% | -0.53% | +0.64% |
Exactech (EXAC) | 11-4-13 | 0.30% | 3.28% | -2.98% |
AGCO Corp. (AGCO) | 5-6-14 | -1.08% | 2.53% | -3.61% |
Stewart Information Services (STC) | 10-1-13 | -0.05% | 5.31% | -5.36% |
ManTech International (MANT) | 7-29-13 | 4.39% | 10.15% | -5.76% |
Fresh Del Monte Produce (FDP) | 5-24-13 | 6.40% | 16.86% | -10.46% |
Stepan Co. (SCL) | 6-28-13 | -2.64% | 17.92% | -20.56% |
Buckle (BKE) | 1-24-13 | 1.79% | 28.46% | -26.67% |
20-Stock Averages |
| 30.37% | 13.69% | 16.68% |
Momentum Portfolio
(thru May 30th)
Roadrunner Stock | Start Date | Roadrunner Performance | Russell 2000 ETF (IWM) | Roadrunner Outperformance? |
G-III Apparel (GIII) | 5-24-13 | 76.25% | 16.86% | +59.39% |
U.S. Physical Therapy (USPH) | 4-26-13 | 42.85% | 23.13% | +19.72% |
Western Refining (WNR) | 1-24-13 | 42.87% | 28.46% | +14.41% |
Valmont Industries (VMI) | 10-1-13 | 13.12% | 5.31% | +7.81% |
Vipshop Holdings (VIPS) | 5-6-14 | 10.26% | 2.53% | +7.73% |
Hill-Rom Holdings (HRC) | 9-3-13 | 17.84% | 12.69% | +5.15% |
VCA Antech (WOOF) | 4-03-14 | -0.36% | -3.70% | +3.34% |
CBOE Holdings (CBOE) | 1-6-14 | 0.20% | -0.53% | +0.73% |
Chase Corp. (CCF) | 1-30-14 | -6.75% | 0.13% | -6.88% |
Apogee Enterprises (APOG) | 11-4-13 | -5.14% | 3.28% | -8.42% |
PriceSmart (PSMT) | 1-24-13 | 18.66% | 28.46% | -9.80% |
International Speedway (ISCA) | 12-2-13 | -9.38% | 1.08% | -10.46% |
Darling International (DAR) | 6-28-13 | 7.13% | 17.92% | -10.79% |
HomeAway (AWAY) | 2-27-13 | 4.62% | 27.01% | -22.39% |
WisdomTree Investments (WETF) | 3-04-14 | -34.24% | -5.57% | -28.67% |
Ocwen Financial (OCN) | 1-24-13 | -4.28% | 28.46% | -32.74% |
LeapFrog Enterprises (LF) | 7-29-13 | -38.83% | 10.15% | -48.98% |
SolarWinds (SWI) | 1-24-13 | -28.46% | 28.46% | -56.92% |
CommVault Systems (CVLT) | 3-28-13 | -40.34% | 21.13% | -61.47% |
HMS Holdings (HMSY) | 1-24-13 | -33.78% | 28.46% | -62.24% |
20-Stock Averages |
| 1.61% | 13.69% | -12.08% |
Correlation Analysis
Please note: The goal of the new Momentum Portfolio will be that all short-term stock holdings move in the same positive direction at the same time. Consequently, going forward, I will only provide correlation data for the Value Portfolio (long-term focus).
The Value Portfolio Front Runner this month provides low correlation with the other existing holdings. Using a stock correlation calculator, I created a correlation matrix for the Roadrunner Value Portfolio, including this month’s recommendation. The time frame for the correlations was daily measuring periods over three years:
Value Portfolio 3-Year Correlations
| GIFI |
AGCO | 0.293 |
BKE | 0.399 |
BRCD | 0.478 |
DHIL | 0.506 |
ECOL | 0.426 |
EXAC | 0.353 |
FDP | 0.288 |
FF | 0.008 |
FN | 0.355 |
GNTX | 0.649 |
GTI | 0.617 |
LDL | 0.498 |
MANT | 0.516 |
SCL | 0.662 |
STC | 0.608 |
UTHR | 0.368 |
WERN | 0.392 |
WEYS | 0.674 |
WRB | 0.329 |
As you can see above, GIFI provides mediocre diversification benefits to the Value Portfolio. Based on my portfolio analysis software, the Value Portfolio was seriously underweight the “energy” sector (caused by the deletion of Carbo Ceramics) and overweight the “cyclical” stock type, so a manufacturer of offshore drilling platforms helped diversify in regard to industry sector but hurt on stock type.
Gulf Island Fabrication has a very low correlation with FutureFuel because a company that benefits from the offshore drilling of oil and gas gets hurt when traditional fossil fuels are replaced by alternative energy such as FutureFuel’s biodiesel which is composed of non-fossil fuels like vegetable oils and animal fats.
Looking at the correlation matrix below, the best diversifiers are those with a lot of red shadings. If you don’t already own AGCO, Exactech, and/or Fresh Del Monte Produce in the Value Portfolio, now would be a good time to pick up some shares as they are both trading at a buyable price level.
A total correlation matrix is shown below:
Value Portfolio

Stock Talk
Add New Comments
You must be logged in to post to Stock Talk OR create an account