China and Oil Throw a Wrench in the Federal Reserve’s Plans
Market Outlook
At the close of trading on Friday, August 7th, the Dow Jones Industrial Average experienced its seventh consecutive down day, the first time in four years (since August 2011) this relentless bearish pattern had occurred. In 2011 when this pattern appeared in reaction to the Standard & Poor’s downgrade of U.S. government debt, stocks declined more than 14% over the next two months. This time may be different because stocks remain near all-time highs and the price decline so far has been very shallow, reflecting no serious macroeconomic or political event, which suggests that the decline is simply a pause that refreshes rather than the beginning of a serious market correction. GMO money manager Jeremy Grantham says the stock market will continue to rise another 5% to 10% before hitting bubble territory and should peak shortly after the 2016 presidential election.
The issues worrying investors include: (1) Greece; (2) China; (3) Oil prices; and (4) Federal Reserve rate hike.
Greece and its creditors reached a deal after an all-night negotiation session on Sunday July 12th that subjected the Greek Prime Minister to “psychological water boarding.” Still, uncertainty remains because this third bailout agreement is more onerous than the one voted down by the Greece electorate on July 5th and does not include any debt forgiveness. The deal is being labeled a “Versailles Treaty” and a “coup” that strips Greece of sovereignty and dignity. Ironically, Germany was the victim of reparations abuse in the 1919 Versailles Treaty and now is the proponent of a similar type of debt abuse for Greece. Despite violent riots in Athens on Wednesday July 15th, the Greek Parliament voted to accept the bailout terms. The German parliament also voted in favor of the bailout on Friday July 17th. On August 10th, markets rallied on news that bailout negotiations are making “unexpectedly quick progress” and that Greek banks may receive the billions in Euros they need by the end of August. In fact, the August 10th rally was a very rare 8.1-to-1 advance/decline volume day, which is powerful positive breadth that typically marks bottoms. But this positive momentum was reversed the following day on news of China’s shocking currency devaluation (see below). As Urban Carmel lamented: “macro and fundies keep getting in the way of good technical set-ups.”
Closer to home, early indications are that Puerto Rico’s debt negotiations with creditors will be just as contentious as those experienced by Greece. On Monday August 3rd, Puerto Rico missed a debt payment for the first time in history.
Another wild card is China, which recently experienced its worst stock market crash in two decades as mainland “A” shares dropped 30% in three weeks. Drastic market manipulation by the Communist government has halted the slide for now, resulting in a 20% bounce back, including the largest one-day gain in a month on August 10th. Another leg down after this temporary manipulation is removed may be in the offing, however, as economic data continues to disappoint with July exports down 8.3%, the largest decline in four months, and July producer prices fell 5.4% year-over-year, the largest decline in six years.
Perhaps more worrisome was the Chinese government’s decision on August 11th and 12th to devalue the Yuan by 3.5%, resulting in the largest one-day exchange-rate decline in 21 years and the lowest Yuan-Dollar exchange rate in four years. This currency devaluation will hurt U.S. multinationals that sell products in China, including Apple, and also hurt oil and metal commodity producers since Chinese demand for commodities will soften with its Yuan’s weaker buying power. Chatter on Wall Street is that this Chinese devaluation is similar to the Asian currency crisis of July/August 1997, which caused the S&P 500 to suffer a 5% market decline over a two-week period only to break to higher highs soon afterwards in September.
The effect on the U.S. of the Chinese stock meltdown is expected to be small because the market crash: (1) focused on mainland “A” shares which foreigners aren’t permitted to own; (2) was the result of bubble valuations and lax margin-borrowing standards; and (3) Chinese consumers don’t own much stock, (equities account for 20 percent of financial assets in Chinese households, compared with 45 percent in cash and bank deposits) so the crash won’t affect their household wealth much and the real Chinese economy should continue to grow at a 7% annualized rate. Both Goldman Sachs and Fidelity say the worst is over and it’s time to buy China.
The last wild card is oil prices, which have been on a roller-coaster ride, first dropping 60% between late June 2014 and March 2015 to six-year lows on Saudi overproduction, then strongly rebounding 45% between March and May on U.S. oil rig shutdowns and ISIS-based chaos in the Middle East, and then dropping back down by 30% since May on both Chinese economic weakness and an Iran nuclear deal that eliminates sanctions and opens up world markets to Iranian oil exports. On August 11th, this second dip in spot West Texas Intermediate (WTI) crude oil prices finally broke below the March low to establish a new six-year low at $43.08. Low oil prices signal weak economies, especially for those countries that are large oil exporters like Russia (GDP contraction of -4.6%). Geopolitical crises often follow economic crises. According to bond king Jeffery Gundlach, if WTI crude oil hits $40, the stock market (and the world generally) could be in for some tough times:
Oil is incredibly important right now. If oil falls to around $40 a barrel then I think the yield on the ten-year treasury note is going to 1% (currently 2.13%). I hope it does not go to $40 because then something is very, very wrong with the world, not just the economy. The geopolitical consequences could be – to put it bluntly – terrifying.
Oil futures expiring in 2016 and 2017 have also dropped below their March lows, which suggests that oil prices could stay depressed for a longer period of time than previously thought (thanks to the Iran deal and continued weakness in China’s economy).
Both the Greece debt bailout and the Iran nuclear deal reduce near-term tensions but promise to increase long-term problems through economic contraction (Greece) and terrorist expansion (Iran). For now, the stock market is focusing on the near-term tension-reducing effects and remaining buoyant as a result.
The U.S. economy is strengthening and the GDP contraction in the first quarter turns out to have been less severe than originally thought (revised upward to only -0.2% from the previous -0.7% estimate). Urban Carmel reports that the majority of macroeconomic data “remains positive” albeit modest and “a recession is not looming ahead” which is the prime cause of bear markets. No recession, no bear market. The Institute for Supply Management (ISM) service index rose in July to its highest level in a decade (60.3), which exceeded the most optimistic projections in a Bloomberg survey of economists. Retail sales were up strongly in July, with upward revisions to both June and May, which led Goldman Sachs to increase its estimate of second-quarter GDP growth to 3.5% annualized from its previous 3.1% estimate.
That said, second-quarter corporate revenue and earnings growth was negative and does not support significantly higher stock prices given already-high valuations. But “smart money” insiders are bullish compared to the dumb money, which suggests that the market will not fall. Accelerated insider buying is protection against a bear market, as is the bullish news that Warren Buffett is spending $32.3 billion to acquire aerospace company Precision Castparts (PCP) for a high P/E multiple of 17.5 times forward earnings. Buying a cyclical company with exposure to the energy industry is a gutsy move. In other words, Buffett appears to be believe waiting for better stock bargains is a losing bet and a flat-to-slightly higher stock market through year end appears likely.
Fed Chairman Janet Yellen confirmed that a rate hike would likely occur “later this year” but was noncommittal as to precise timing. Bond king Jeffrey Gundlach says that although Yellen wants to hike, the economic data will be so weak that the Fed won’t be able to pull the trigger in 2015. The July jobs report met expectations with 215,000 jobs added and the unemployment remained stable at 5.3%. The report wasn’t super strong, but it was strong enough to convince many economists that the Federal Reserve has enough to data to justify a rate hike at the September meeting. Others point to the cautionary language in the Fed’s July 29th policy statement, which requires some additional improvement/confidence in both labor markets and inflation. The July jobs report on August 7th provided additional labor improvement, but increased confidence that inflation is rising to the 2% annual level remains lacking. Fed Vice Chairman Stanley Fischer voiced concern about “very low” inflation, which some analysts took as a signal that the Fed will probably wait until December to raise rates. The China devaluation is added fodder for a December time frame since it hurts U.S. economic exports and growth. Long-term bond prices are breaking out to the upside, which suggests economic weakness ahead.
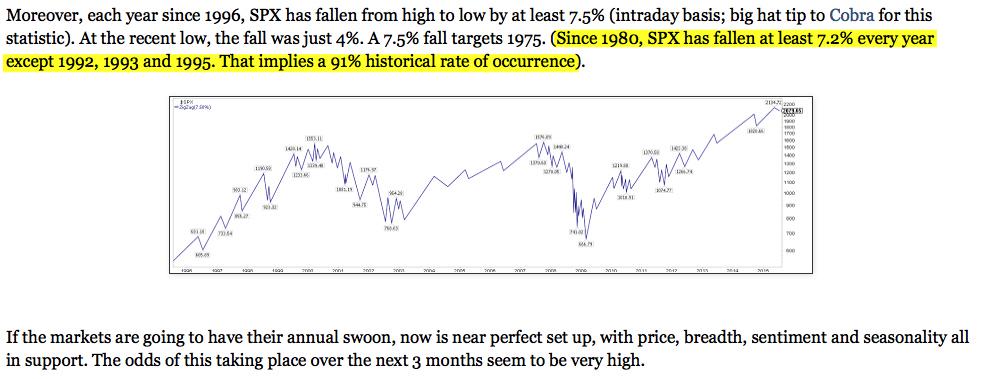
Investor sentiment is hitting bearish extremes, which from a contrarian perspective suggests a short-term one-month rally is likely. The ISEE 10-day call/put ratio hit a seven-year low on August 11th, the most bearish options traders have been since November 2008, which was during the teeth of the global financial crisis. If a short-term rally through early September occurs, however, there is still a chance for one final washout low into October because the S&P 500 has fallen at least 7.5% from its peak price each year since 1996, which this year would mean a price level of 1,975 — 5.3% below the current S&P level of 2,086.
Bottom line: For now, I would stay invested because the Ivy Portfolio market-timing system based on the 10-month moving average remains on a “buy” signal for U.S. stocks, foreign stocks, and U.S. Treasury bonds (sells are real estate and commodities).
Roadrunner Stocks Relative Performance
Fears about financial and political instability in Greece, China, Iran, as well as declining oil prices and a likely Federal Reserve decision to hike interest rates soon have all contributed to investor unease and caused a rush into the relative safety of large-cap stocks. Small-cap stocks do best in a calm and high-growth market environment, which is not now. Over the past three months, small-cap outperformance has vacillated wildly from a low of 33% of the time as of May 22nd (nine of 27 Roadrunner time periods) up to 61% of the time as of June 26th (17 of 28 time periods), and back down to 45% of the time as of July 31st (13 of 29 time periods).
Of the 13 periods of small-cap outperformance, all 13 have come from momentum. In other words, value has not outperformed in any of the 29 time periods since the launch of Roadrunner Stocks in January 2013, which is highly unusual. Of the 14 most recent time periods, small-cap momentum has been the outperformance winner 12 times and large caps twice. Simply put, small-cap momentum is hot and small-cap value is not, but this one-sided outperformance is unlikely to last much longer. A contrarian would argue that value is now oversold and ready to bounce. I continue to advocate the diversification benefits of investing in both the value and momentum equity styles.
As I explained in the initial January 2013 Roadmap article entitled Your Destination to Profits, the best long-term investment results will be achieved from a diversified portfolio consisting of both value and momentum stocks. A 50-50 allocation to value and momentum is the “holy grail” of investing.
Comparative Index Total Return
(Thru July 31st)
Roadrunner Issue Start Date | S&P 500 ETF (SPY) | Vanguard Small-Cap Value (VBR) | PowerShares DWA SmallCap Momentum (DWAS) | Advantage |
January 24th, 2013 | 46.96% | 42.93% | 47.18% | Small-cap Momentum |
February 27th, 2013 | 44.55% | 39.82% | 43.47% | Large cap |
March 28th, 2013 | 39.49% | 33.77% | 34.14% | Large cap |
April 26th, 2013 | 38.06% | 35.43% | 35.43% | Large cap |
May 24th, 2013 | 32.15% | 29.49% | 29.15% | Large cap |
June 28th, 2013 | 35.40% | 31.29% | 28.84% | Large cap |
July 29th, 2013 | 28.85% | 23.62% | 19.83% | Large cap |
September 3rd, 2013 | 32.18% | 28.07% | 19.90% | Large cap |
October 1st, 2013 | 27.71% | 20.29% | 11.72% | Large cap |
November 4th, 2013 | 22.29% | 16.11% | 12.05% | Large cap |
December 2nd, 2013 | 19.80% | 14.43% | 8.07% | Large cap |
January 6th, 2014 | 17.93% | 12.40% | 7.78% | Large cap |
January 30th, 2014 | 19.97% | 13.52% | 8.45% | Large cap |
March 4th, 2014 | 14.62% | 7.28% | 1.18% | Large cap |
April 3rd, 2014 | 13.48% | 6.11% | 7.09% | Large cap |
May 6th, 2014 | 14.58% | 9.36% | 17.77% | Small-cap Momentum |
June 5th, 2014 | 10.07% | 4.67% | 12.16% | Small-cap Momentum |
July 7th, 2014 | 7.88% | 2.38% | 7.81% | Large cap |
August 7th, 2014 | 11.55% | 7.56% | 16.36% | Small-cap Momentum |
September 10th, 2014 | 6.51% | 2.78% | 10.18% | Small-cap Momentum |
October 10th, 2014 | 11.33% | 12.83% | 24.01% | Small-cap Momentum |
November 11th, 2014 | 3.89% | 2.24% | 10.16% | Small-cap Momentum |
December 15th, 2014 | 6.27% | 5.60% | 13.56% | Small-cap Momentum |
January 13th, 2015 | 4.35% | 2.88% | 9.16% | Small-cap Momentum |
February 18, 2015 | 0.34% | -1.70% | 4.95% | Small-cap Momentum |
March 19, 2015 | 0.60% | -2.77% | -0.45% | Large cap |
April 29, 2015 | -0.37% | -3.36% | 2.88% | Small-cap Momentum |
June 1, 2015 | -0.87% | -3.42% | 1.71% | Small-cap Momentum |
July 8, 2015 | 2.06% | -0.51% | 3.23% | Small-cap Momentum |
Source: Bloomberg
More than half (21 out of 40) of Roadrunner recommendations have outperformed their respective small-cap benchmarks and both the Value and Momentum portfolios have positive double-digit percentage average returns. The Value Portfolio shows 9 out of 20 holdings (45%) outperforming VBR and sports an average return of 13.59%, 1.26 percentage points better than VBR. In contrast, the Momentum Portfolio has 12 of its 20 holdings (60%) outperforming DWAS and sports an average return of 42.63%, blowing away DWAS by an astounding 29.82 percentage points. When individual momentum stocks outperform an index, they REALLY outperform!
Performance Scorecard
Overall, 22 of 40 Roadrunner holdings (55%) have generated positive absolute returns. Below, each Roadrunner portfolio lists the best relative performers in descending order:
Value Portfolio
(thru July 31st)
Roadrunner Stock | Start Date | Roadrunner Performance | Vanguard Small-Cap Value (VBR) | Roadrunner Outperformance? |
Diamond Hill Investment Group (DHIL) | 1-24-13 | 191.73% | 43.12% | +148.61% |
Alliance Fiber Optic Products (AFOP) | 11-11-14 | 46.62% | 2.36% | +44.26% |
Brocade Communications (BRCD) | 2-27-13 | 83.86% | 40.03% | +43.83% |
U.S. Ecology (ECOL) | 9-3-13 | 65.21% | 28.29% | +36.92% |
Gentex (GNTX) | 1-24-13 | 77.89% | 43.10% | +34.79% |
W.R. Berkley (WRB) | 3-04-14 | 40.06% | 7.32% | +32.74% |
NMI Holdings (NMIH) | 3-19-15 | 5.65% | -2.63% | +8.28% |
MSC Industrial Direct (MSM) | 6-1-15 | 2.29% | -3.23% | +5.52% |
SJW Corp. (SJW) | 4-29-15 | -2.30% | -3.23% | +0.93% |
Weis Markets (WMK) | 7-08-15 | -2.41% | -0.35% | -2.06% |
Weyco Group (WEYS) | 1-30-14 | 6.95% | 13.54% | -6.59% |
Vishay Precision Group (VPG) | 10-10-14 | -8.41% | 12.94% | -21.35% |
Lattice Semiconductor (LSCC) | 2-18-15 | -29.33% | -1.59% | -27.74% |
Sanderson Farms (SAFM) | 7-7-14 | -25.94% | 2.51% | -28.45% |
Exactech (EXAC) | 11-4-13 | -16.45% | 16.29% | -32.74% |
Harte-Hanks (HHS) | 12-15-14 | -31.52% | 5.70% | -37.22% |
Stepan Co. (SCL) | 6-28-13 | -10.17% | 31.57% | -41.74% |
Rayonier Advanced Materials (RYAM) | 1-13-15 | -39.67% | 3.10% | -42.77% |
RPC Inc. (RES) | 9-10-14 | -40.69% | 2.99% | -43.68% |
Gulf Island Fabrication (GIFI) | 6-05-14 | -41.63% | 4.85% | -46.48% |
20-Stock Averages |
| 13.59% | 12.33% | 1.26% |
Momentum Portfolio
(thru July 31st)
Roadrunner Stock | Start Date | Roadrunner Performance | PowerShares DWA SmallCap Momentum (DWAS) | Roadrunner Outperformance? |
G-III Apparel (GIII) | 5-24-13 | 236.59% | 29.16% | +207.43% |
Marcus & Millichap (MMI) | 8-7-14 | 112.93% | 16.45% | +96.48% |
U.S. Physical Therapy (USPH) | 4-26-13 | 127.52% | 35.45% | +92.07% |
China Biologic Products (CBPO) | 1-13-15 | 85.30% | 9.33% | +75.97% |
VCA Inc. (WOOF) | 4-03-14 | 81.37% | 7.17% | +74.20% |
Apogee Enterprises (APOG) | 11-4-13 | 72.48% | 12.13% | +60.35% |
Hill-Rom Holdings (HRC) | 9-3-13 | 66.69% | 19.91% | +46.78% |
Vipshop Holdings (VIPS) | 5-6-14 | 35.98% | 17.85% | +18.13% |
The Ensign Group (ENSG) | 2-18-15 | 22.71% | 5.11% | +17.60% |
CBOE Holdings (CBOE) | 1-6-14 | 25.13% | 8.00% | +17.13% |
Concordia Healthcare (CXRX) | 7-08-15 | 10.84% | 3.53% | +7.31% |
Chase Corp. (CCF) | 1-30-14 | 15.17% | 8.53% | +6.64% |
Multi-Color Corp. (LABL) | 6-1-15 | -1.88% | 2.00% | -3.88% |
Paycom Software (PAYC) | 4-29-15 | -0.99% | 3.02% | -4.01% |
Taro Pharmaceutical (TARO) | 12-15-14 | 2.70% | 13.88% | -11.18% |
Gentherm (THRM) | 9-10-14 | -3.02% | 10.50% | -13.52% |
Platform Specialty Products (PAH) | 11-11-14 | -7.64% | 10.47% | -18.11% |
OmniVision Technologies (OVTI) | 11-11-14 | -9.91% | 10.47% | -20.38% |
EQT Midstream Partners L.P. (EQM) | 8-7-14 | -4.07% | 16.60% | -20.67% |
NuStar GP Holdings (NSH) | 8-7-14 | -15.23% | 16.60% | -31.83% |
20-Stock Averages |
| 42.63% | 12.81% | 29.82% |
Value Portfolio 3-Year Correlations
UTMD | |
AFOP | -0.030 |
DHIL | 0.252 |
ECOL | 0.339 |
EXAC | 0.227 |
GIFI | -0.225 |
GNTX | 0.136 |
HHS | -0.106 |
LSCC | 0.422 |
MSM | 0.273 |
NMIH | 0.347 |
RES | -0.111 |
RYAM | 0.270 |
SAFM | -0.175 |
SCL | 0.086 |
SJW | 0.564 |
VPG | 0.200 |
WEYS | 0.571 |
WMK | 0.220 |
WRB | 0.239 |
As you can see above, Utah Medical Products provides excellent diversification benefits to the Value Portfolio. Based on my portfolio analysis software, after deleting computer network equipment manufacturer Brocade Communications, the Value Portfolio was severely underweight the “healthcare” sector and was equal-weight the “classic growth” stock type. Utah Medical Products is both healthcare and classic growth, so adding this stock helps diversify the portfolio in one important way (industry sector).
Value Portfolio Composition After Brocade Communications is Sold
But Before Utah Medical Products is Added
Industry Sector | Roadrunner Value Portfolio | Mid/Small Cap Benchmark | |
Cyclical | 42.14 | 40.89 | |
Basic Materials | 10.47 | 5.19 | |
Consumer Cyclical | 15.59 | 15.65 | |
Financial Services | 16.08 | 15.07 | |
Real Estate | 0 | 4.98 | |
Sensitive | 36.85 | 40.31 | |
Communication Services | 0 | 1.30 | |
Energy | 10.52 | 5.40 | |
Industrials | 10.55 | 17.29 | |
Technology | 15.77 | 16.33 | |
Defensive | 21.01 | 18.77 | |
Consumer Defensive | 10.47 | 4.63 | |
Healthcare | 5.25 | 11.43 | |
Utilities | 5.30 | 2.71 |
Stock Type | Roadrunner Value Portfolio | Mid/Small Cap Benchmark | |
High Yield | 5.14 | 0.98 | |
Distressed | 0 | 2.57 | |
Hard Asset | 10.52 | 9.04 | |
Cyclical | 42.02 | 51.73 | |
Slow Growth | 10.44 | 10.22 | |
Classic Growth | 5.25 | 5.57 | |
Aggressive Growth | 21.02 | 9.43 | |
Speculative Growth | 5.60 | 5.87 | |
Not Classified | 0 | 4.60 |
Source: Morningstar
Utah Medical Products has a very low correlation with Gulf Island Fabrication (GIFI) because women’s healthcare is a staple and not sensitive to economic growth, whereas oil drilling structures are extremely cyclical. Utah Medical Products also has low correlation with Sanderson Farms (SAFM) because . . . well, chicken processing appears to be in its own clucky world and exhibits low correlation with almost every other stock regardless of industry sector! That’s why I keep Sanderson Farms around.
Looking at the correlation matrix below, the best diversifiers are those with a lot of red shadings. If you don’t already own poultry-processor Sanderson Farms (SAFM), energy services firm RPC Corp. (RES), or cigarette-filter manufacturer Rayonier Advanced Materials (RYAM) in the Value Portfolio, now would be a good time to pick up some shares as all three are currently trading at a buyable price level.
A total correlation matrix is shown below:
Value Portfolio

Stock Talk
Add New Comments
You must be logged in to post to Stock Talk OR create an account